 Stay
Stay 
Trading Conditions
Products
Tools


Trend analysis (Fig. 1).
On Thursday, the price may go up from 1.2144 (closing of yesterday's daily candlestick) to the 76.4% retracement level of 1.2196 (red dotted line). Should the quote test this mark, it may then rise to the 85.4% retracement level of 1.2247 (red dotted line) and extend the uptrend.
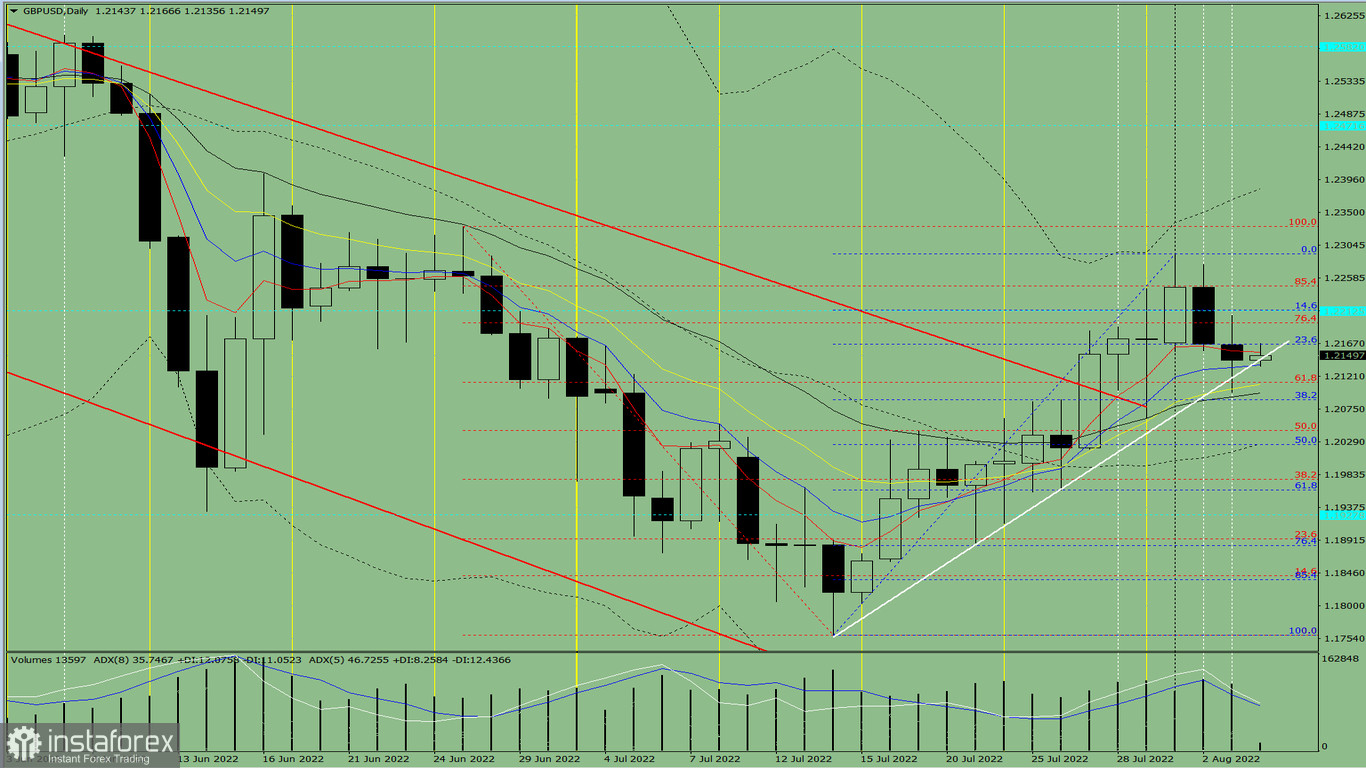
Fig. 1 (daily chart).
Complex analysis:
- indicator analysis - down
- Fibonacci levels - down
- volumes - down
- candlestick analysis - up
- trend analysis - up
- Bollinger bands - up
- weekly chart - up
Final thoughts:
On Thursday, the price may go up from the mark of 1.2144 (closing of yesterday's daily candlestick) to the 76.4% retracement level of 1.2196 (red dotted line). Should the quote test this mark, it may then rise to the 85.4% retracement level of 1.2247 (red dotted line) and extend the uptrend.
Alternative scenario: the price may go up from the mark of 1.2144 (closing of yesterday's daily candlestick) to the 76.4% retracement level of 1.2196 (red dotted line). Should the quote test this mark, a pullback may occur to the 38.2% retracement level of 1.2084 (blue dotted line), and then the uptrend could extend.
InstaForex analytical reviews will make you fully aware of market trends! Being an InstaForex client, you are provided with a large number of free services for efficient trading.


