 Stay
Stay 
Trading Conditions
Products
Tools


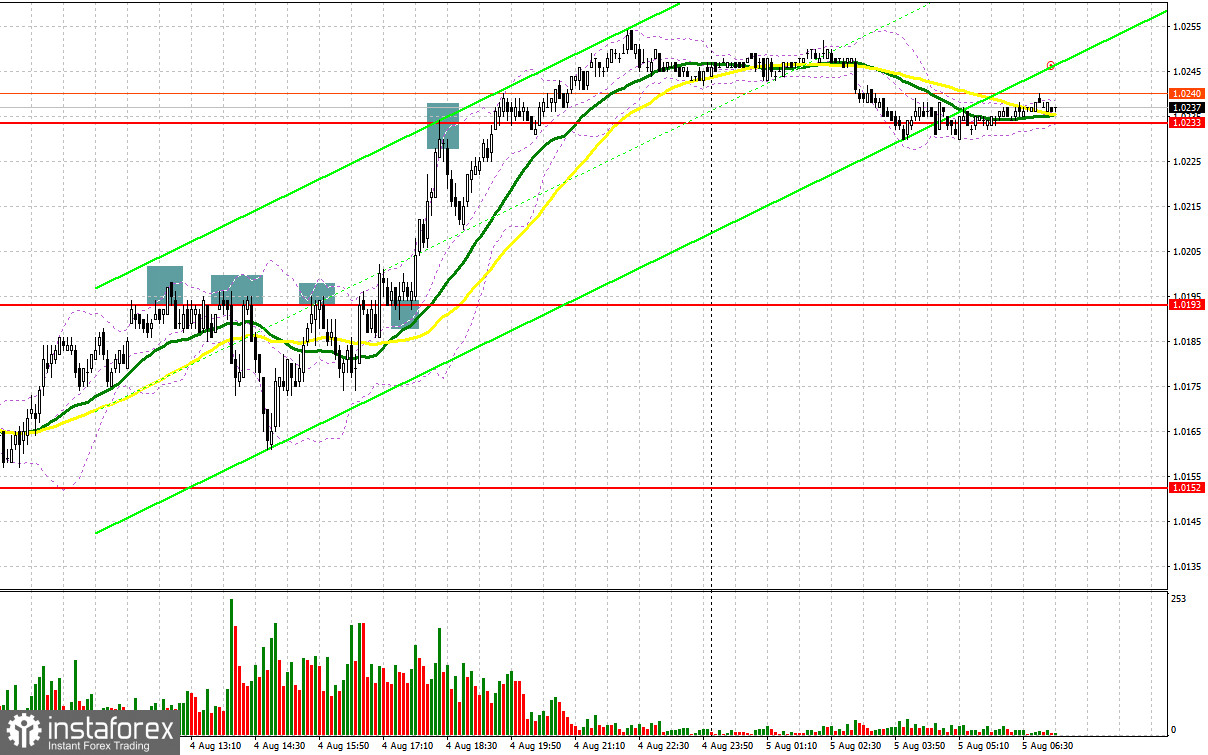
Several market entry signals were formed yesterday. Let's take a look at the 5-minute chart and see what happened. I paid attention to the 1.0152 level in my morning forecast and advised making decisions on entering the market from it. As a result of the euro's movement in the morning down to the area of 1.0152, before the test. It was not possible to get a good buy signal for this reason. Then the pair grew to the area of 1.0193, but it also failed to break above this range. A false breakout on it gave a signal to sell, which resulted in the euro's fall by more than 35 points. The bears tried once again to protect 1.0193 closer to the afternoon and they succeeded, but the downward movement was weaker - only 15 points. This led to the idea that sooner or later the bulls will break through 1.0193, which happened: a reverse test from the top to the bottom of this range gave a great buy signal, which resulted in an increase of more than 40 points to the 1.0233 area, where I sold on a false breakout, getting a move down 20 points.
When to go long on EUR/USD:
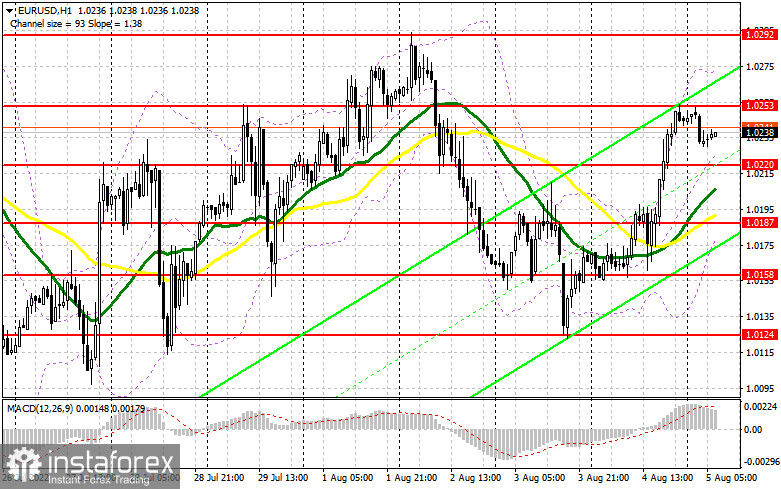
Given that the euro is gradually returning to monthly highs, we can say that there are large players in the market, betting on the growth of risky assets. If today's data on the US labor market turns out to be disappointing, a breakdown of the major resistance at 1.0292 and reaching new local highs is not ruled out. But first, I recommend paying attention to European statistics: the change in industrial production in Germany and the change in industrial production in France are unlikely to seriously affect the pair's direction, but good numbers will instill confidence in investors and traders, proving that not everything is as bad as it seems. If the pair goes down after the reports, I expect bulls to take more active steps towards the immediate support area of 1.0220, formed on the basis of yesterday's results. Forming a false breakout there will provide the first signal to open long positions in hopes of building an upward trend with the prospect of updating resistance at 1.0253. A breakthrough and test from the top down of this range will hit the bears' stop orders, creating another signal to enter long positions with the possibility of moving up to 1.0292, where the main struggle for further medium-term direction of the pair will unfold. The farthest target will be the area of 1.0323, where I recommend taking profits, but we will only be able to reach this level in the most negative scenario for the US labor market.
If the EUR/USD declines and there are no bulls at 1.0220, the pressure on the pair will increase slightly, which will keep trading in the horizontal channel and open the way to the next support at 1.0187, where the moving averages play on the bulls' side. The best option for opening long positions would be a false breakout at this level. I advise you to buy EUR/USD immediately on a rebound only from 1.0158, or even lower - in the area of 1.0124, counting on an upward correction of 30-35 points within the day.
When to go short on EUR/USD:
The bears tried with all their might to defend a rather important resistance at 1.0200 yesterday, but alas, on the fourth attempt, the bulls broke through higher. This resulted in removing stop orders and to a more active growth of the euro amid disappointing statistics on the US. But despite such changes, it is still quite early to say that the market has come under the bulls' control. All the "dots over and" today will dot the data on the US labor market, but it seems to me that trade will remain within a wide horizontal channel and nothing serious will happen. A good option to sell the euro in the first half of the day would be a false breakout in the area of the nearest resistance of 1.0253, by analogy with what I analyzed above. This will help create a signal to open short positions, which will lead to the euro moving down to the 1.0220 area. A breakdown and consolidation below this range, as well as a reverse test from the bottom up - all this creates another sell signal with the removal of bulls' stop orders and a larger movement of the pair to the 1.0187 area even before the release of US statistics. Consolidating below this area is a direct road to 1.0158, where I recommend completely leaving short positions. A more distant target will be the area of 1.0124, but it will be available only in case of very strong US data.
In case EUR/USD moves up during the European session, as well as the absence of bears at 1.0253, I advise you to postpone short positions to 1.0292 - the upper limit of the wide horizontal channel, which I mentioned above. Forming a false breakout there will be a new starting point for entering short positions. You can sell EUR/USD immediately on a rebound from this month's high in the area of 1.0323, or even higher - from 1.0374, counting on a downward correction of 30-35 points.
COT report:
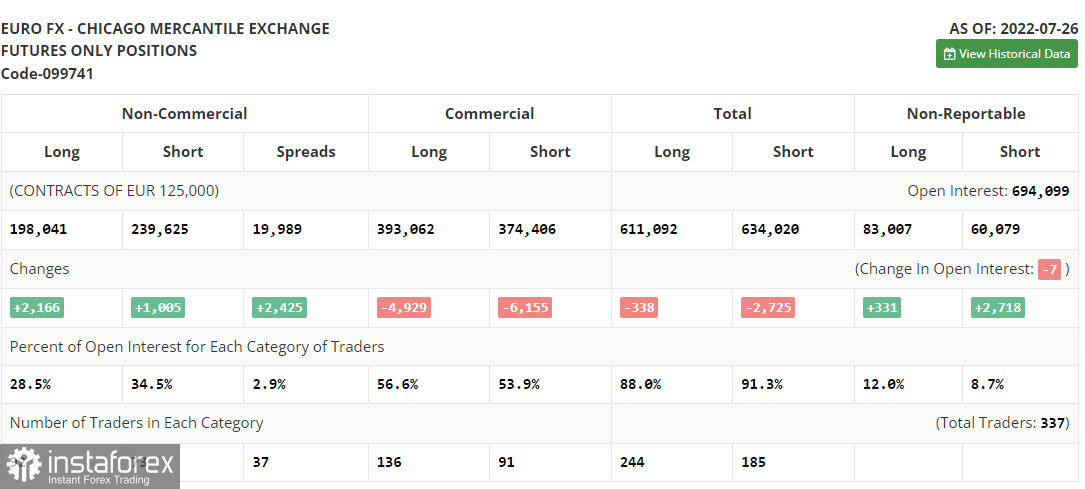
The Commitment of Traders (COT) report for July 26 logged an increase in both short and long positions, but the former turned out to be more, which indicates a gradual end of the bear market and an attempt to find a market bottom after reaching euro parity against the US dollar. Obviously, the data on the European economy that was released last week helped the euro to some extent. A slight acceleration in the growth of the consumer price index was offset by a sharp upsurge in the European economy in the second quarter of this year. GDP growth of 4.0% per annum surprised many economists, which supported the bullish mood of traders after the Federal Reserve hinted at a possible milder further cycle of interest rate hikes. All this will make it possible for us to count on further upward movement of the EUR/USD pair. The COT report shows that long non-commercial positions rose by 2,166 to 198,041, while short non-commercial positions jumped by 1,005 to 239,625. At the end of the week, the overall non-commercial net position, although it remained negative, rose slightly from -42,745 to -41,584. The weekly closing price decreased and amounted to 1.0161 against 1.0278.
Indicator signals:
Moving averages
Trading is above the 30 and 50-day moving averages, indicating the bulls' attempt to show their strength.
Note: The period and prices of moving averages are considered by the author on the H1 hourly chart and differs from the general definition of the classic daily moving averages on the daily D1 chart.
Bollinger Bands
In case of a decline, the lower border of the indicator around 1.0180 will act as support. In case of growth, the upper border of the indicator in the area of 1.0270 will act as resistance.
Description of indicators
InstaForex analytical reviews will make you fully aware of market trends! Being an InstaForex client, you are provided with a large number of free services for efficient trading.

