 Stay
Stay 
Trading Conditions
Products
Tools


Yesterday, the euro/dollar pair managed to resume its upward movement without any reason, but in the afternoon it lost almost everything gained by "overwork". It is still too early to talk about the strong correction we are waiting for. "Early" - in the sense that yesterday's fall in comparison with the previous growth is too small. However, we remind you that all of the euro's recent growth is practically not supported by anything. Yes, there were important statements by members of the Federal Reserve, there was an important report on US inflation, which could have provoked a fall in the dollar. But not as strong. Yesterday, for example, traders did not pay any attention to the EU GDP report. Although we already said that there might not be a reaction, not only did the market not react, it continued to work "according to its own rules". The ascending trendline continues to signal an upward trend, most of the indicators are also pointing up.
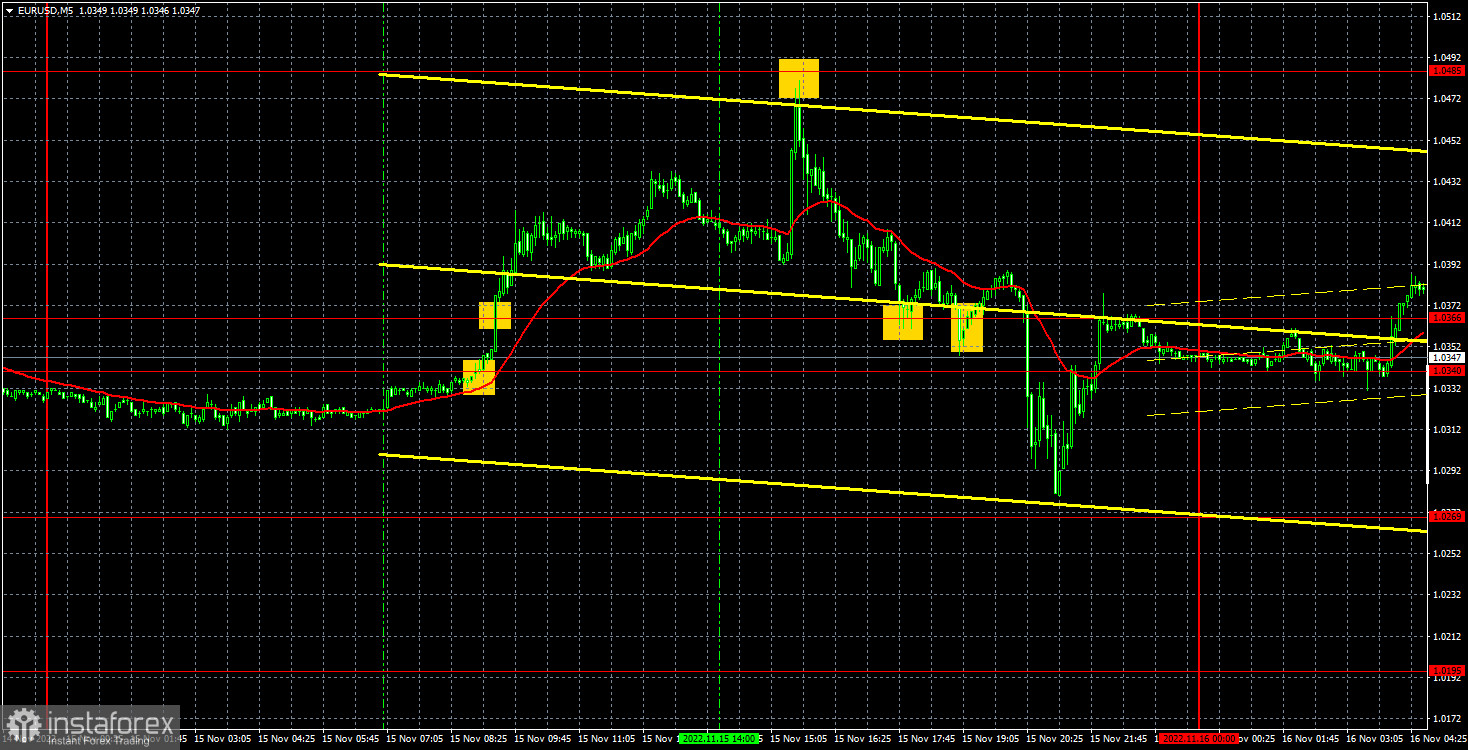
In regards to trading signals, the situation on the 5-minute timeframe was close to ideal. At the beginning of the European trading session, the level of 1.0340 was overcome, so traders should have opened long positions immediately. This was followed by surpassing 1.0366 and growth almost to the level of 1.0485. The "error" of working out this level was only 4 points, but after the growth by 130 points at least it was possible to close the position without waiting for the target to be worked out pointwise. A sell signal near the 1.0485 level could be worked out, but it was possible not to, if the "error" was confusing. In the first case, it was possible to earn another 70 points. In any case, the day turned out to be very profitable.
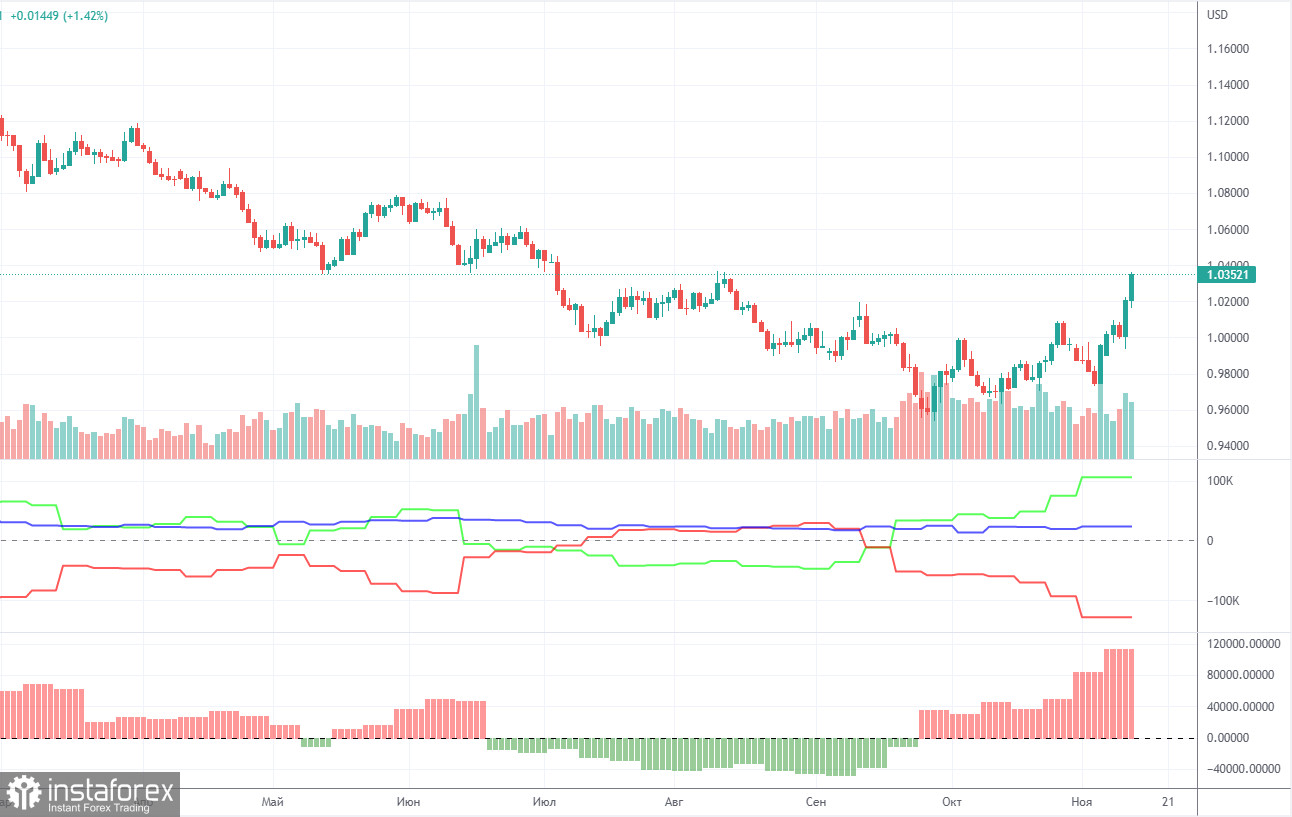
In 2022, the Commitment of Traders (COT) report for the euro is becoming more and more interesting. In the first part of the year, the reports were pointing to the bullish sentiment among professional traders. However, the euro was confidently losing value. Then, for several months, reports were reflecting bearish sentiment and the euro was also falling. Now, the net position of non-commercial traders is bullish again. The euro managed to rise above its 20-year low, adding 500 pips. This could be explained by the high demand for the US dollar amid the difficult geopolitical situation in the world. Even if demand for the euro is rising, high demand for the greenback prevents the euro from growing.
In the given period, the number of long positions initiated by non-commercial traders increased by 13,000, whereas the number of short orders declined by 17,000. As a result, the net position increased by 30,000 contracts. However, this could hardly affect the situation since the euro is still at the bottom. The second indicator in the chart above shows that the net position is now quite high, but a little higher there is a chart of the pair's movement itself and we can see that the euro again cannot benefit from this seemingly bullish factor. The number of longs exceeds the number of shorts by 106,000, but the euro is still trading low. Thus, the net position of non-commercial traders may go on rising without changing the market situation. If we look at the overall indicators of open longs and shorts across all categories of traders, then there are 23,000 more shorts (617,000 vs 594,000).
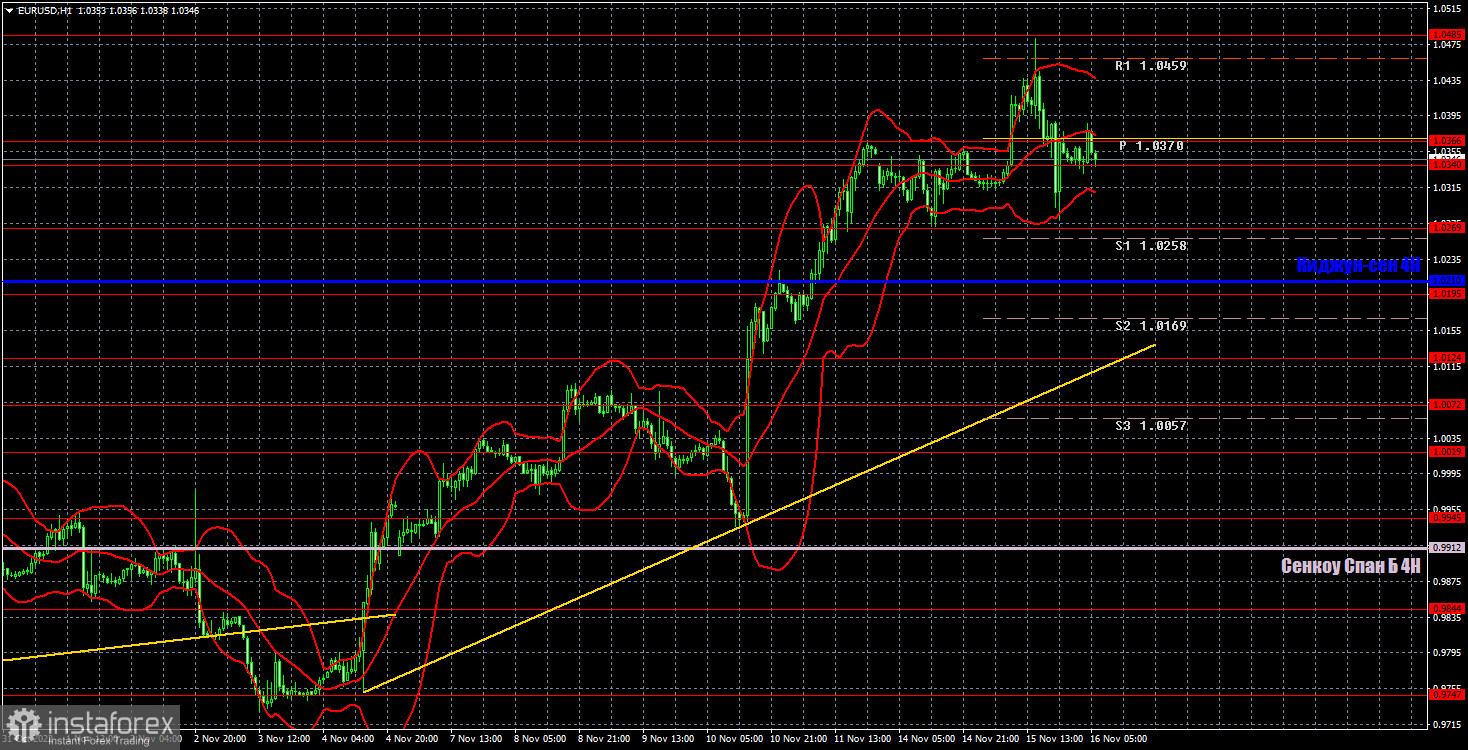
You can see that the pair continues to rise on the one-hour chart, has overcome the Ichimoku cloud on the 24-hour chart, as well as all the Ichimoku lines on the 4-hour chart. Last week, the reason for the growth was, of course, the US inflation report. However, it is rather difficult to say why the steady and strong growth is still present this week.
On Wednesday, the pair may trade at the following levels: 1.0072, 1.0119, 1.0195, 1.0269, 1.0340-1.0366, 1.0485, 1.0579, 1.0637, as well as the Senkou Span B (0.9912) and Kijun-sen (1.0210). Lines of the Ichimoku indicator may move during the day, which should be taken into account when determining trading signals. There are also support and resistance levels, but signals are not formed near these levels. Bounces and breakouts of the extreme levels and lines could act as signals. Don't forget about stop-loss orders, if the price covers 15 pips in the right direction. This will prevent you from losses in case of a false signal.
European Central bank President Christine Lagarde will deliver a speech in the European Union, which might be very interesting, since traders will be waiting for her comments on monetary policy. On the other hand, there are only minor reports on retail sales and industrial production in the US.
Price levels of support and resistance are thick red lines, near which the movement may end. They do not provide trading signals.
The Kijun-sen and Senkou Span B lines are the lines of the Ichimoku indicator, moved to the one-hour chart from the 4-hour one. They are strong lines.
Extreme levels are thin red lines from which the price bounced earlier. They provide trading signals.
Yellow lines are trend lines, trend channels, and any other technical patterns.
Indicator 1 on the COT charts reflects the net position size of each category of traders.
Indicator 2 on the COT charts reflects the net position size for the non-commercial group.
InstaForex analytical reviews will make you fully aware of market trends! Being an InstaForex client, you are provided with a large number of free services for efficient trading.


