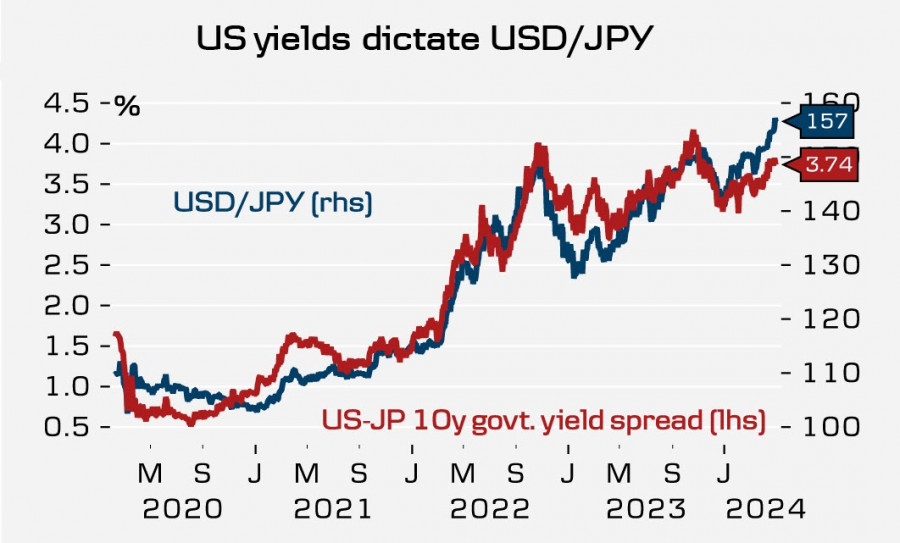
This information is provided to retail and professional clients as part of marketing communication. It does not contain and should not be construed as containing investment advice or investment recommendation or an offer or solicitation to engage in any transaction or strategy in financial instruments. Past performance is not a guarantee or prediction of future performance. Instant Trading EU Ltd. makes no representation and assumes no liability as to the accuracy or completeness of the information provided, or any loss arising from any investment based on analysis, forecast or other information provided by an employee of the Company or otherwise. Full disclaimer is available here.
Analytics today
Popular analytics
Apparently, the Japanese authorities did conduct a currency intervention on April 29th. The USD/JPY pair came close to the 160 mark, after which it quickly fell to 154.50. A weak.
Analysis of the GBP/USD pair on April 30th. Last chance for the dollar
The wave analysis for the GBP/USD pair remains quite complex. A successful attempt to break through the Fibonacci level of 50.0% indicated the market's readiness to build a downward wave.
GBP/USD: trading plan for the US session on April 30th (analysis of morning deals). The pound is kept within the side channel
In my morning forecast, I paid attention to the 1.2516 level and planned to make decisions on entering the market from it. Let's look at the 5-minute chart and figure.
EUR/USD: trading plan for the US session on April 30th (analysis of morning deals). The euro is trying to end the month on a positive note
In my morning forecast, I pointed out the level of 1.0726 and planned to make trading decisions based on it. Let's look at the 5-minute chart and figure out what.
Trading Signals for Bitcoin (BTC/USD) for April 30 - May 7, 2024: sell below $62,500 (21 SMA - 4/8 Murray)
Bitcoin is trading around 61,266 under strong bearish pressure. During the European session, it tried to break the top of the bearish trend channel forming since March 30 around 64,700.
Trading Signals for Ethereum (ETH/USD) for April 30 - May 7, 2024: sell below $3,177 (21 SMA - 1/8 Murray)
The eagle indicator is giving an oversold signal. So, we believe Ether could get a technical bounce in the coming days if it finds a good bottom around the psychological.
USD/JPY: trading tips for beginners for European session on April 30
The price test of 156.53 at the beginning of the US session occurred at a time when the MACD indicator sharply rose from the zero mark, which limited the pair's.
Technical Analysis of Intraday Price Movement of Gold Commodity Asset, Tuesday April 30, 2024.
With the appearance of deviation between price movement with Stochastic Oscillator indicator as well as the appearance of bearish Flag pattern as well as supporting by EMA 20 which intersects.
Technical Analysis of Intraday Price Movement of AUD/CAD Cross Currency Pairs, Tuesday April 30, 2024.
If we pay attention to the 4 hour chart of AUD/CAD cross currency pairs, there is the appearance of deviation between price movement with Stochastic Oscillator indicator which also happens.
Show more
This section is updated daily and contains market analysis prepared by professional analysts on behalf of InstaForex. Each of the specialists presents analytical reviews in accordance with his/her vision of the current situation on the foreign exchange and other markets. However, the outlooks below are neither recommendations nor instructions to any actions. They contain analysis of the current situation on financial markets. In some cases, analysts' opinions about current market conditions may differ.