 Stay
Stay 
Trading Conditions
Products
Tools


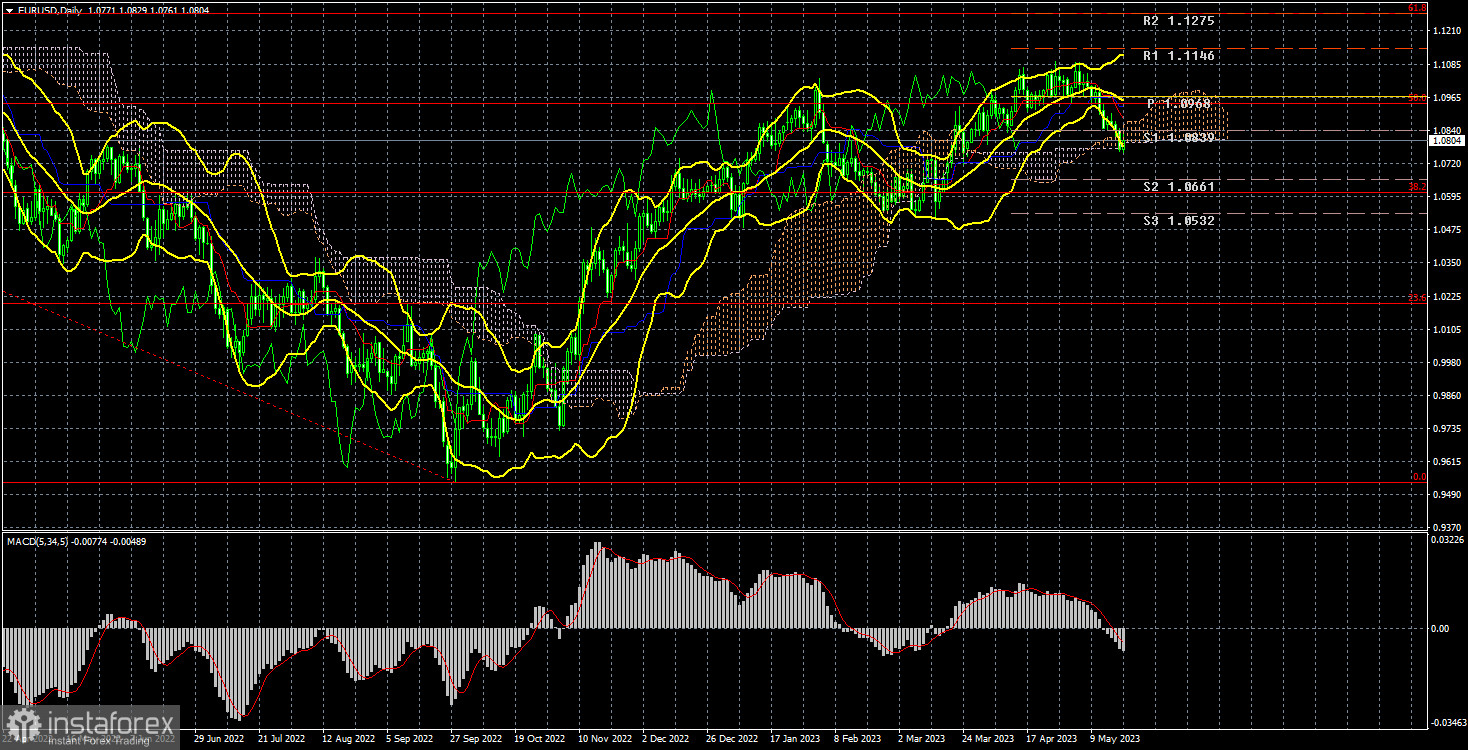
The EUR/USD pair showed only a downward movement throughout the current week and was around the Senkou Span B line on the 24-hour TF by the end of the week. This line provides strong support and can provide real resistance to the bears. However, the fact that the European currency is finally falling is encouraging. As you can see (and the illustration above shows it perfectly), the pair has been growing for a long time. Moreover, from a fundamental point of view, it was completely baseless. From time to time, factors appeared that worked against the dollar or supported the euro, but there were also opposing factors, and only the euro was growing. Therefore, the pair ended up in an area of strong overbought and now can show movement to the south just as baseless.
The fall should continue at least to the level of 1.0500. In the future, everything will depend on the fundamental background, gradually becoming neutral for both currencies. The fact is that both central banks are close to completing the cycle of tightening monetary policy, so there are no strong factors influencing the price. They may appear in the future (for example, another bank in Europe or the USA will go bankrupt), but none are on the horizon for now. For 3-6 months, the pair can go into consolidation, looking at the 24-hour TF-like movement within a wide sideways channel. All movement after January 1 is already perfectly suited to "consolidation."
The fundamental background this week was extensive but almost meaningless. There were many speeches by ECB and Fed representatives, but each time their statements contained only some new information for the market. Therefore, the euro's fall was unrelated to the "fundamental," and there were very few macroeconomic statistics during the week.
COT analysis.
On Friday, a new COT report for May 16 came out. For the past nine months, the COT report data completely corresponded to what was happening in the market. The illustration above shows that the net position of large players (the second indicator) began to grow in September 2022. Around the same time, the European currency began to grow. Currently, the net position of non-commercial traders is "bullish," remains very high, and continues to grow, as does the European currency itself.
We have already drawn traders' attention to the fact that a fairly high value of the "net position" allows us to assume a quick end to the upward trend. This is signaled by the first indicator, on which the red and green lines have moved far apart, often preceding the trend's end. The European currency tried to start falling a few months ago, but what we saw was just a trivial and not very strong pullback. During the last reporting week, the number of buy contracts for the "non-commercial" group decreased by 1.6 thousand, and the number of shorts - by 9.6 thousand. Accordingly, the net position grew again by 8 thousand contracts. The number of buy contracts is already higher than sell contracts, among non-commercial traders - 187 thousand, which is a very large gap. The difference is more than threefold. A correction is still brewing (and perhaps it has even already begun), so even without COT reports, it is clear that the pair should fall.
Analysis of fundamental events.
There were only a few important publications in the European Union during the current week. On Monday, a report on industrial production was published, much weaker than forecasts. On Tuesday, the second estimate of GDP for the first quarter came out, fully matching forecasts and the previous value. On Wednesday - the second estimate of inflation for April did not differ from the first. There were no macroeconomic publications on Thursday and Friday. Therefore, it can be said with absolute certainty that statistics were not the reason for the euro's fall. The reasons were a technical need to correct and a fundamental global background, which did not imply euro growth in the last 2.5 months. The American economy does not look weaker, the statistics are better, and the key rate is higher. The ECB is preparing to end the tightening cycle in a couple of meetings, and the market has had enough time and opportunities to work out all rate hikes "in advance."
Trading plan for the week of May 22–26:
Explanations for the illustrations:
Support and resistance price levels, Fibonacci levels - are the levels that are the targets when opening purchases or sales. Take Profit levels can be placed around them.
Ichimoku indicators (standard settings), Bollinger Bands (standard settings), MACD (5, 34, 5).
Indicator 1 on the COT charts - the size of the net position of each category of traders.
Indicator 2 on the COT charts - the size of the net position for the "non-commercial" group.
InstaForex analytical reviews will make you fully aware of market trends! Being an InstaForex client, you are provided with a large number of free services for efficient trading.

