 Stay
Stay 
Trading Conditions
Products
Tools


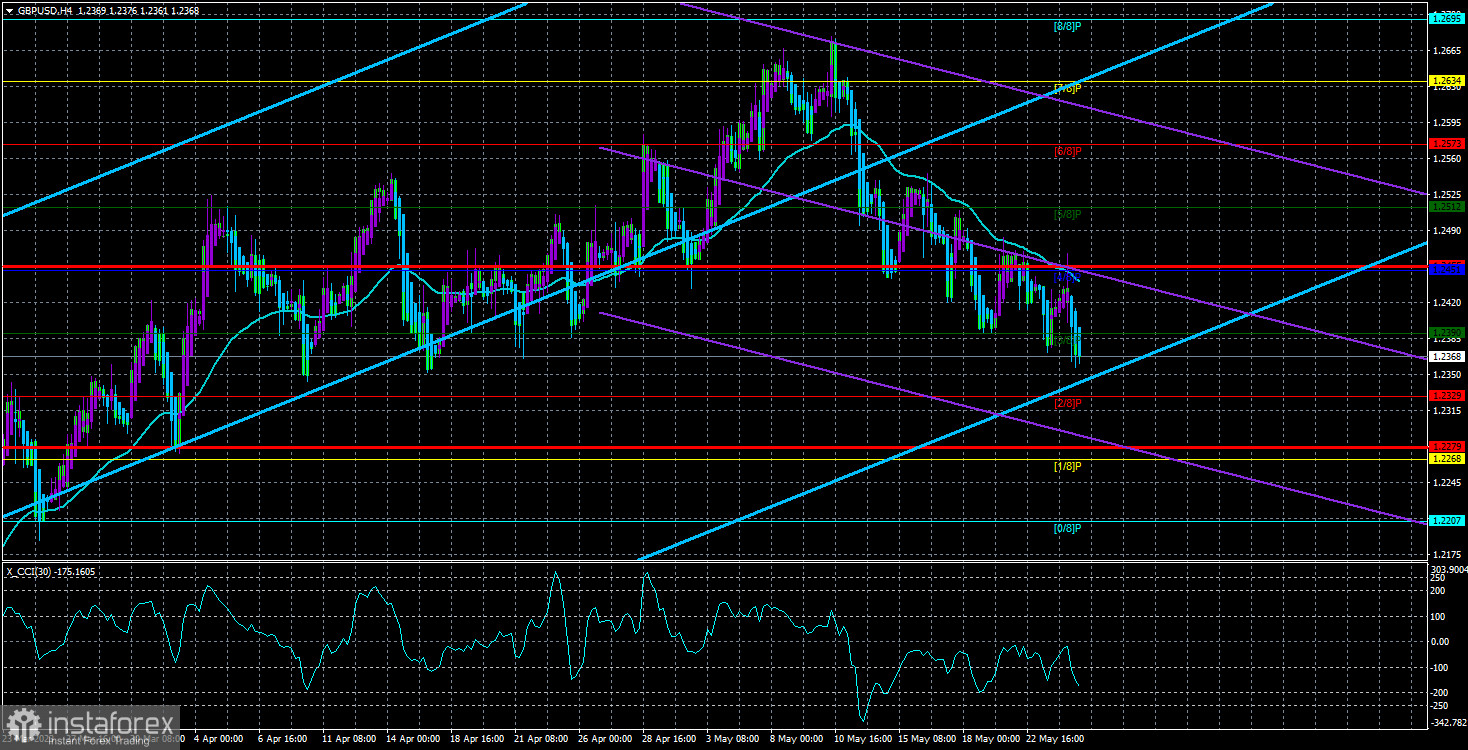
The GBP/USD currency pair attempted to surpass the moving average line on Wednesday and resume its downward movement but ultimately failed. However, the recent local minimum (from the day before yesterday) was updated, indicating that the downward trend persists. The pound is slowly sliding down, as it should, based on almost all possible factors. The current decline of the pound is too weak considering the combination of reasons that should push it down. Therefore, the British currency is lucky. Nevertheless, it should be noted that in cases where all factors point in one direction, the pair is not obligated to move in that direction by 100-200 points every day. Hence, the current movement could be better (with too many intraday pullbacks), but at the same time, it is stable. The Heiken Ashi indicator frequently changes the direction of movement, so it is best to trade in a medium-term style.
In the 24-hour time frame, the current downward movement is hardly noticeable. We can draw the same conclusions as with the EUR/USD pair. In 2021-2022, there was a clear and strong downtrend. In the last quarter of 2022, a significant upward correction took place. Since the beginning of this year, the pair may be in a consolidation phase. This is the same as moving in a sideways channel or flat. The difference is that channels or flats usually have clear boundaries, while consolidations do not. The pair can easily surpass the recent highs and lows but remains in the same price range overall. This is what we are observing now.
For a long time, we considered the level of 1.2440 as the upper boundary of the sideways channel. Eventually, it was surpassed in early April. What has happened in the past one and a half months? The pound rose another 200 points at its peak, although it has no further reasons to rise. However, despite Andrew Bailey's "moderately hawkish" statements, there are plenty of reasons for a decline.
It's a million-dollar puzzle with an obvious conclusion
Traders awaited yesterday. Suppose we remove from the radar all the speeches by the Bank of England, ECB, and Fed representatives, which mostly did not provide the market with anything new. In that case, very little macroeconomic data was released last week and this week. Of course, there are always business activity indices or consumer sentiment indices from the University of Michigan or unemployment benefit claims. However, these are different from the data that allows us to judge the state of any particular economy.
The report on British inflation had serious intrigue. Experts expected a slowdown to 8.2% from a value of 10.1%. In other words, a drop of almost 2% in one month. Naturally, this bold forecast did not materialize. Inflation only declined to 8.7% y/y, which is still very good when considering it is British inflation. However, the absurdity parade begins from here, which has been going hand in hand with Britain for about five years, just manifesting itself differently. In monthly terms, inflation accelerated from 0.8% to 1.2%! Thus, the sharp decline in annual inflation may be simply a numerical "error." At the same time, core inflation increased by 0.6% to a record value of 6.8%.
If we were asked what we could say about this report and what conclusion we could draw, we would say that inflation did not slow down in practice. This means only one thing: the Bank of England needs to continue tightening monetary policy at the maximum pace. However, the step of raising rates has already been reduced to a minimum, and the rate has reached a "limiting" level. The market does not expect more than two rate hikes; only Andrew Bailey continues to pour optimism. He expects inflation to be around 5% by the end of the year and is ready to tighten policy if needed. However, the Bank of England can no longer aggressively tighten, and the market has long priced in all rate hikes. Therefore, the British pound should wait to receive any support soon.
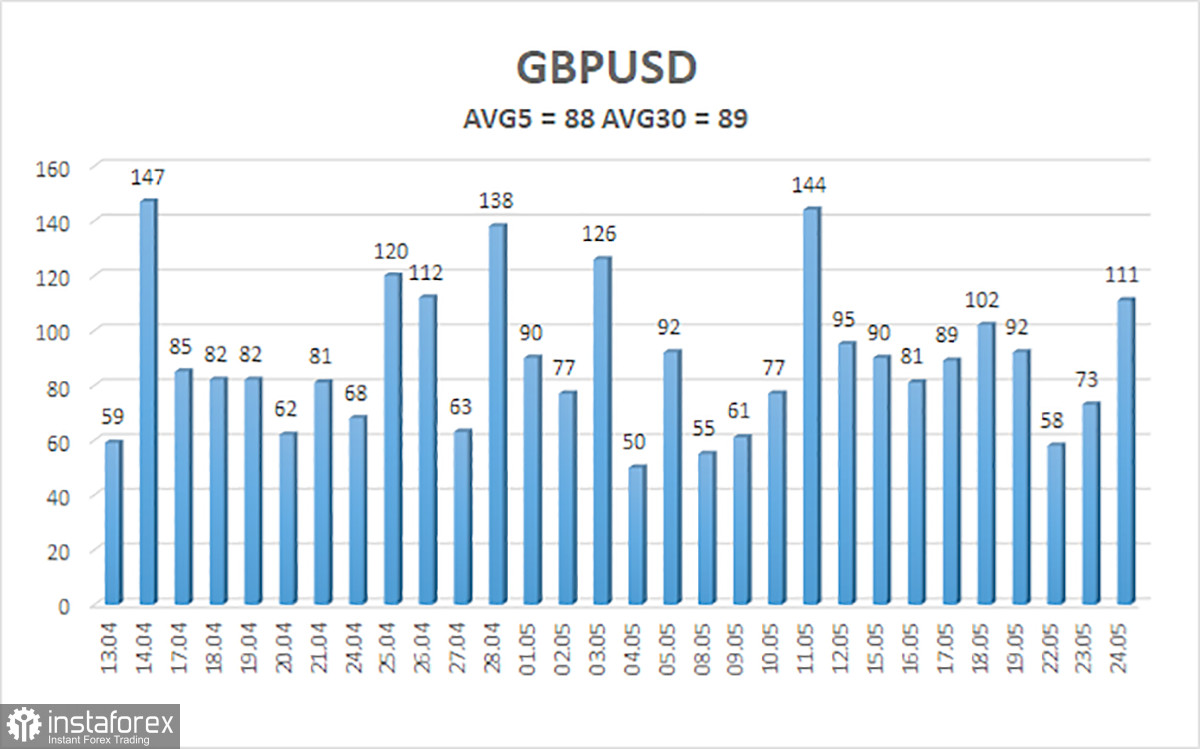
The average volatility of the GBP/USD pair over the past five trading days is 88 pips. For the pound/dollar pair, this value is considered "average." Therefore, on Thursday, May 25, we expect movement within the channel, limited by the levels of 1.2279 and 1.2455. An upward reversal of the Heiken Ashi indicator will signal a new stage of the corrective movement.
Nearest support levels:
S1 - 1.2329
S2 - 1.2268
S3 - 1.2207
Nearest resistance levels:
R1 - 1.2390
R2 - 1.2451
R3 - 1.2512
Trading recommendations:
On the 4-hour timeframe, the GBP/USD pair has resumed its decline, so short positions with targets at 1.2329 and 1.2279 remain relevant, to be held until the price consolidates above the moving average. Long positions can be considered if the price consolidates above the moving average with a target of 1.2512.
Explanations for the illustrations:
Linear regression channels - help determine the current trend. If both point in the same direction, it indicates a strong trend.
Moving average line (settings 20,0, smoothed) - determines the short-term trend and direction for trading.
Murray levels - target levels for movements and corrections.
Volatility levels (red lines) - the probable price channel in which the pair will move the next day, based on current volatility indicators.
CCI indicator - its entry into the oversold zone (below -250) or overbought zone (above +250) indicates an approaching trend reversal in the opposite direction.
InstaForex analytical reviews will make you fully aware of market trends! Being an InstaForex client, you are provided with a large number of free services for efficient trading.


