 Stay
Stay 
Trading Conditions
Products
Tools

The pair has been moving in a corrective phase around the middle band of Bollinger bands. The nearest support lies at 1.3470, where the 200 SMA is located on the H1 chart. If GBP/USD makes a breakout of the 1.3589 level, then it can go towards the psychological zone of 1.3700. To the downside, a critical level remains in place around 1.3451.
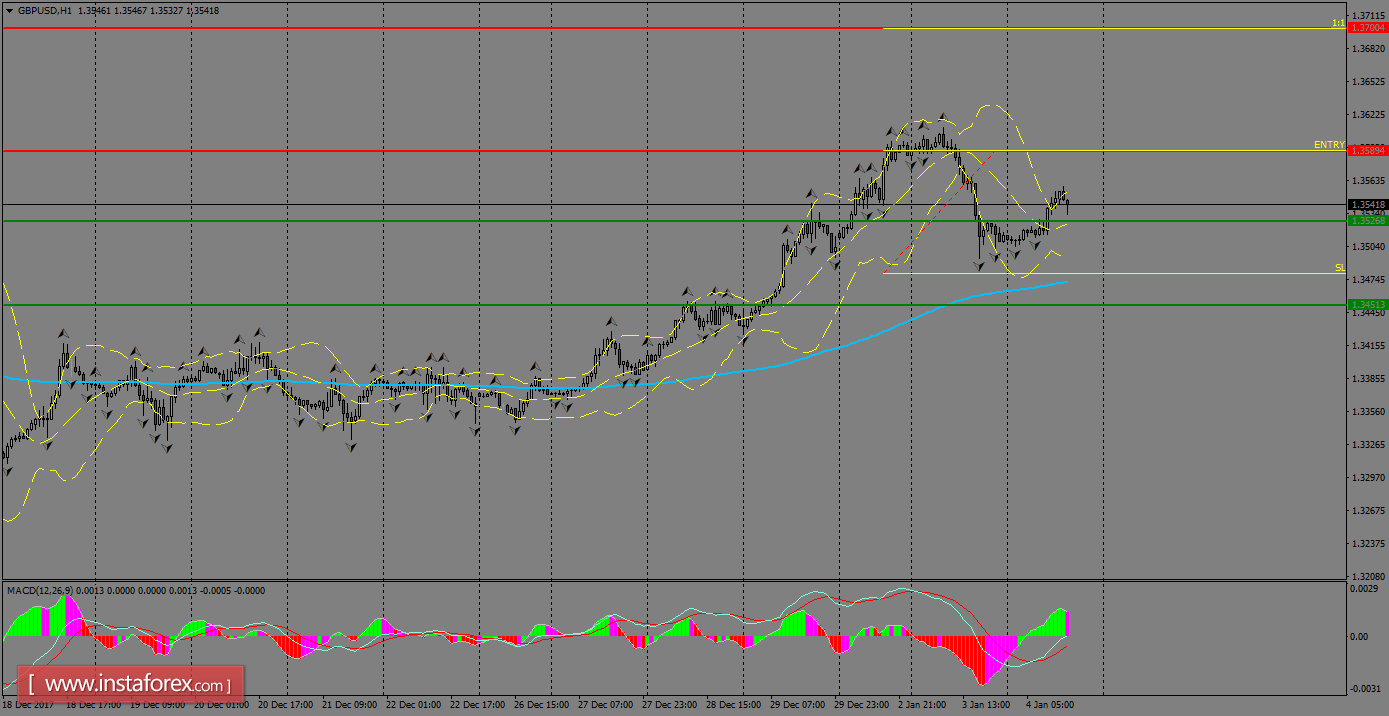
H1 chart's resistance levels: 1.3589 / 1.3700
H1 chart's support levels: 1.3526 / 1.3451
Trading recommendations for today: Based on the H1 chart, buy (long) orders only if the GBP/USD pair breaks a bullish candlestick; the resistance level is at 1.3589, take profit is at 1.3700 and stop loss is at 1.3480.
InstaForex analytical reviews will make you fully aware of market trends! Being an InstaForex client, you are provided with a large number of free services for efficient trading.


