 Stay
Stay 
Trading Conditions
Products
Tools

The index is doing a breakout of the resistance level at 92.10, which is currently finding dynamic resistance in the 200 SMA at H1 chart. That area should cap further gains in order to perform a pullback towards the support zone of 91.68. A consolidation below that level should expose the 91.13 level. MACD indicator is entering the overbought territory.
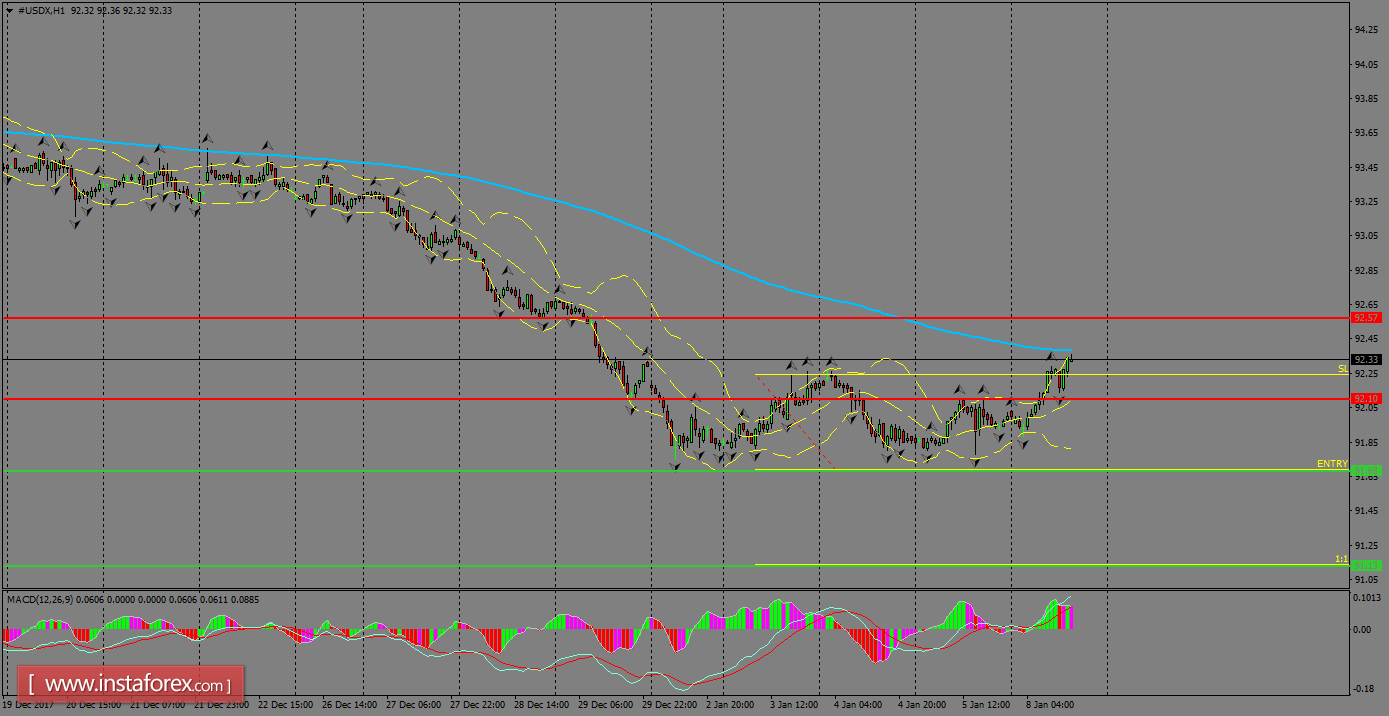
H1 chart's resistance levels: 92.10 / 92.57
H1 chart's support levels: 91.68 / 91.13
Trading recommendations for today: Based on the H1 chart, place sell (short) orders only if the USD Index breaks with a bearish candlestick; the support level is at 91.68, take profit is at 91.13 and stop loss is at 92.24.
InstaForex analytical reviews will make you fully aware of market trends! Being an InstaForex client, you are provided with a large number of free services for efficient trading.


