 Zostať
Podmienky obchodovania
Nástroje


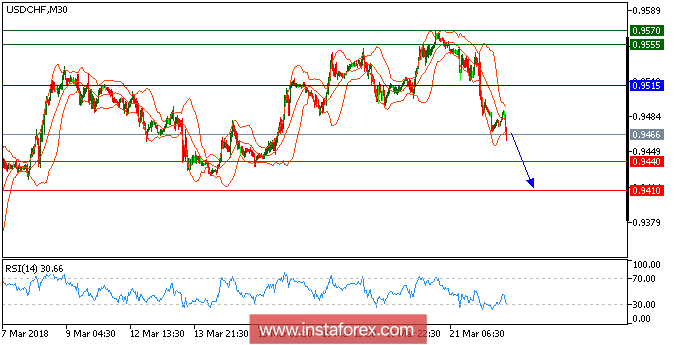
USD/CHF is under pressure and expected to trade with a bearish outlook. The pair keeps showing downward momentum while scaling the lower Bollinger band. The relative strength index has sank into the over-sold region of the 30s without signs of a bullish divergence. And the bearish intraday outlook is maintained by the descending 20-period moving average, which stays below the 50-period one. Immediate downside support should be found at 0.9515. Below this level the pair should drop further toward 0.9440.
Chart Explanation:
The black line shows the pivot point. The present price above the pivot point indicates a bullish position, and the price below the pivot point indicates a short position. The red lines show the support levels, and the green line indicates the resistance levels. These levels can be used to enter and exit
trades.
Strategy: SELL, stop loss at 0.515, take profit at 0.9440.
Resistance levels: 0.9555, 0.9570, and 0.9600
Support levels: 0.9440, 0.9410, and 0.9350.
InstaForex analytical reviews will make you fully aware of market trends! Being an InstaForex client, you are provided with a large number of free services for efficient trading.

