 Zostať
Podmienky obchodovania
Nástroje


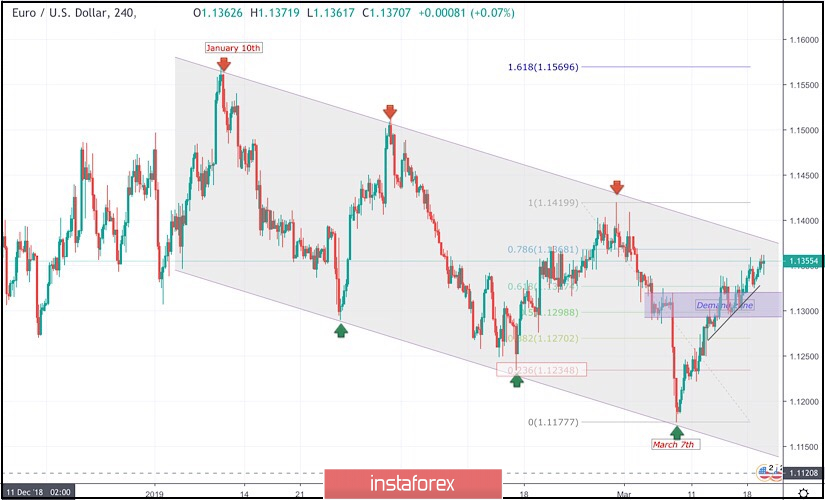
On January 10th, the market initiated the depicted bearish channel around 1.1570.
The bearish channel's upper limit managed to push price towards 1.1290 then 1.1235 before the EUR/USD pair could come again to meet the channel's upper limit around 1.1420.
Bullish fixation above 1.1430 was needed to enhance further bullish movement towards 1.1520.
However, the market has been demonstrated obvious bearish rejection around 1.1430
That's why, the recent bearish movement was demonstrated towards 1.1175 (channel's lower limit) where significant bullish recovery was demonstrated on March 7th.
Bullish persistence above 1.1270 (Fibonacci 38.2%) enhanced further bullish advancement towards 1.1290-1.1315 (the Highlighted-Zone) where temporary bearish rejection was demonstrated.
Last week, the EUR/USD pair demonstrated a temporary bullish breakout above 1.1315 which was followed by a period of indecision/hesitation that brought the pair again within the depicted supply zone.
This week, another bullish breakout attempt is being executed above 1.1327 (61.8% Fibonacci level).
This probably enhances a further bullish movement towards 1.1370 and 1.1390 where the upper limit of the depicted movement channel is located.
On the other hand, bearish breakout below the price level of 1.1298 (50% Fibonacci) will probably liberate a quick bearish retraction towards 1.1235 (23.6 Fibonacci level)then 1.1180 where the lower limit of the movement channel can be tested again.
Trade recommendations :
Risky traders can wait for the current bullish pullback to pursue towards 1.1390-1.1400 for a valid SELL signal.
T/P levels to be located around 1.1330, 1.1290 and 1.1220. S/L to be located above 1.1450.
InstaForex analytical reviews will make you fully aware of market trends! Being an InstaForex client, you are provided with a large number of free services for efficient trading.

