 Zostať
Podmienky obchodovania
Nástroje


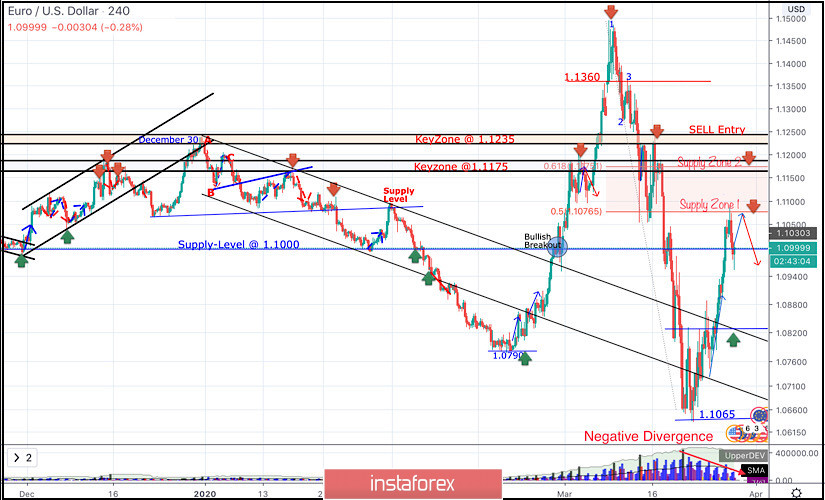
Since December 30, the EURUSD pair has trended-down within the depicted bearish channel until few weeks ago, when extensive bearish decline established a new low around 1.0790 where the EUR/USD pair looked OVERSOLD after such extensive bearish decline.
On February 20, recent signs of bullish recovery were demonstrated around 1.0790 leading to the recent steep bullish movement towards 1.1000, 1.1175, 1.1360 and finally 1.1480 where a (123) bearish reversal pattern was initiated around.
This turned the short-term technical outlook for the EURUSD pair into bearish when bearish persistence below the Keyzone of 1.1235 was maintained on a daily basis.
Moreover, the mentioned intermediate-term bearish Head & Shoulders pattern has achieved all of its projection target levels.
Earlier this week, the EURUSD pair has expressed significant bullish recovery around 1.1065
The recent bullish engulfing H4 candlesticks as well as the recently-demonstrated ascending bottoms indicated a high probability bullish pullback at least towards 1.0980 and 1.1075 (Fibonacci Level 50%) that should be watched by conservative traders for probable bearish rejection.
On Tuesday, Intraday traders were looking for bullish persistence above 1.0790 - 1.0830 as this enabled further bullish advancement to pursue towards higher levels.
Further bullish advancement towards 1.1075 was executed as expected by the end of Yesterday's consolidations.
On the other hand, negative divergence is being demonstrated on the depicted H4 chart suggesting a high probability bearish rejection to occur around the current supply levels to be tested.
Key Supply levels in confluence with significant Fibonacci levels are located around 1.1075 (50% Fibonacci) and 1.1175 (61.8% Fibonacci) where bearish rejection was highly-expected.
Trade recommendations :
Intraday traders can wait for another bullish pullback towards the mentioned key-level around 1.1075 and look for some bearish rejection signs (Double-Top Pattern) as valid SELL signals for short-term trades.
S/L to be placed above 1.1130 while Initial T/P level to be located around 1.1000.
InstaForex analytical reviews will make you fully aware of market trends! Being an InstaForex client, you are provided with a large number of free services for efficient trading.


