 Zostať
Podmienky obchodovania
Nástroje


EUR/USD is trading this morning of the American session above the 21-day EMA and above the 3/8 Murray, since we have not yet seen a break of the descending triangle, and it is likely that it will continue to rise to the resistance of 1.1962 (Murray 4/8).
Only a break and a consolidation above the (4/8 murray) zone of 1.1962 be the beginning of a new upward movement to 1.20 psychological level and 1.2085 (6/8 murray).
Looking at the bigger picture, additional gains are likely in EUR / USD as long as it is above the 21-day moving average on the 4-hour chart. Zone above 1.19.
In daily charts on Thursday, a Doji candle has left, which implies indecision in the market, it is important to note if today Friday closes below this level, we could expect a downward movement next week, on the contrary, a close above the 1.1940 high of the Doji candle would mean that the period of indecision is over and allow the upward movement to continue to 1.2085.
Our recommendation is that you wait for the price to rise to the 1.1962 resistance zone, if it fails to break this level it would be a good opportunity to sell this pair with targets at the 21-day Ema (1.1901)
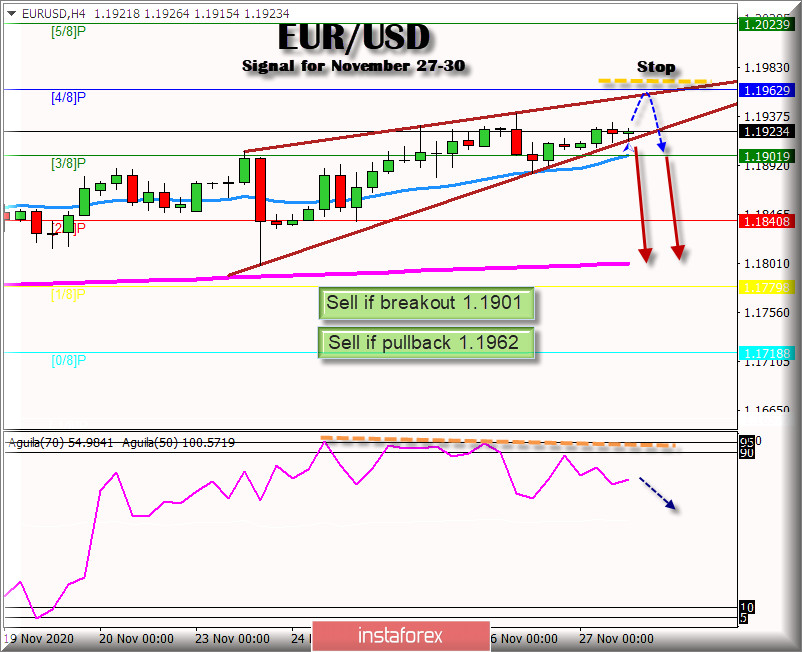
On the other hand, a break of the triangle and a consolidation below the 3/8 of murray, will give us the opportunity of a new bearish cycle with targets at the EMA of 200 (1.1801)
The eagle indicator is showing a sign of exhaustion, and with an imminent bearish movement for the next few days.
Market sentiment has remained intact this week with 70% of investors selling this EUR / USD pair, so it is likely that there could still be bullish movements in this pair, before a sustainable decline.
Trading tip for EUR/USD for November 27 – 30
Sell if the pair breaks below 1.1901 with take profit at 1.1840 (2/8 murray) and 1.1801 (EMA 200), and stop loss above 1.1960.
Buy if the pair rebound around EMA 200 at 1.1801 with take profit at 1.1840 (2/8 murray) and 1.1901 and stop loss below 1.1770.
Sell if the pair pullback to 1.1962, with take profit 1.1901 and 1.1840, Stop loss above 1,1990.
InstaForex analytical reviews will make you fully aware of market trends! Being an InstaForex client, you are provided with a large number of free services for efficient trading.


