 Zostať
Podmienky obchodovania
Nástroje


The New Zealand "Kiwi" main pair continues to ascend on the chart, which started in mid-2015. Structure analysis of this section shows the formation of the first two parts of the wave model (A and B). With high probability since November 17 last year, we can state the beginning of the formation of the final part (C) of the structure.
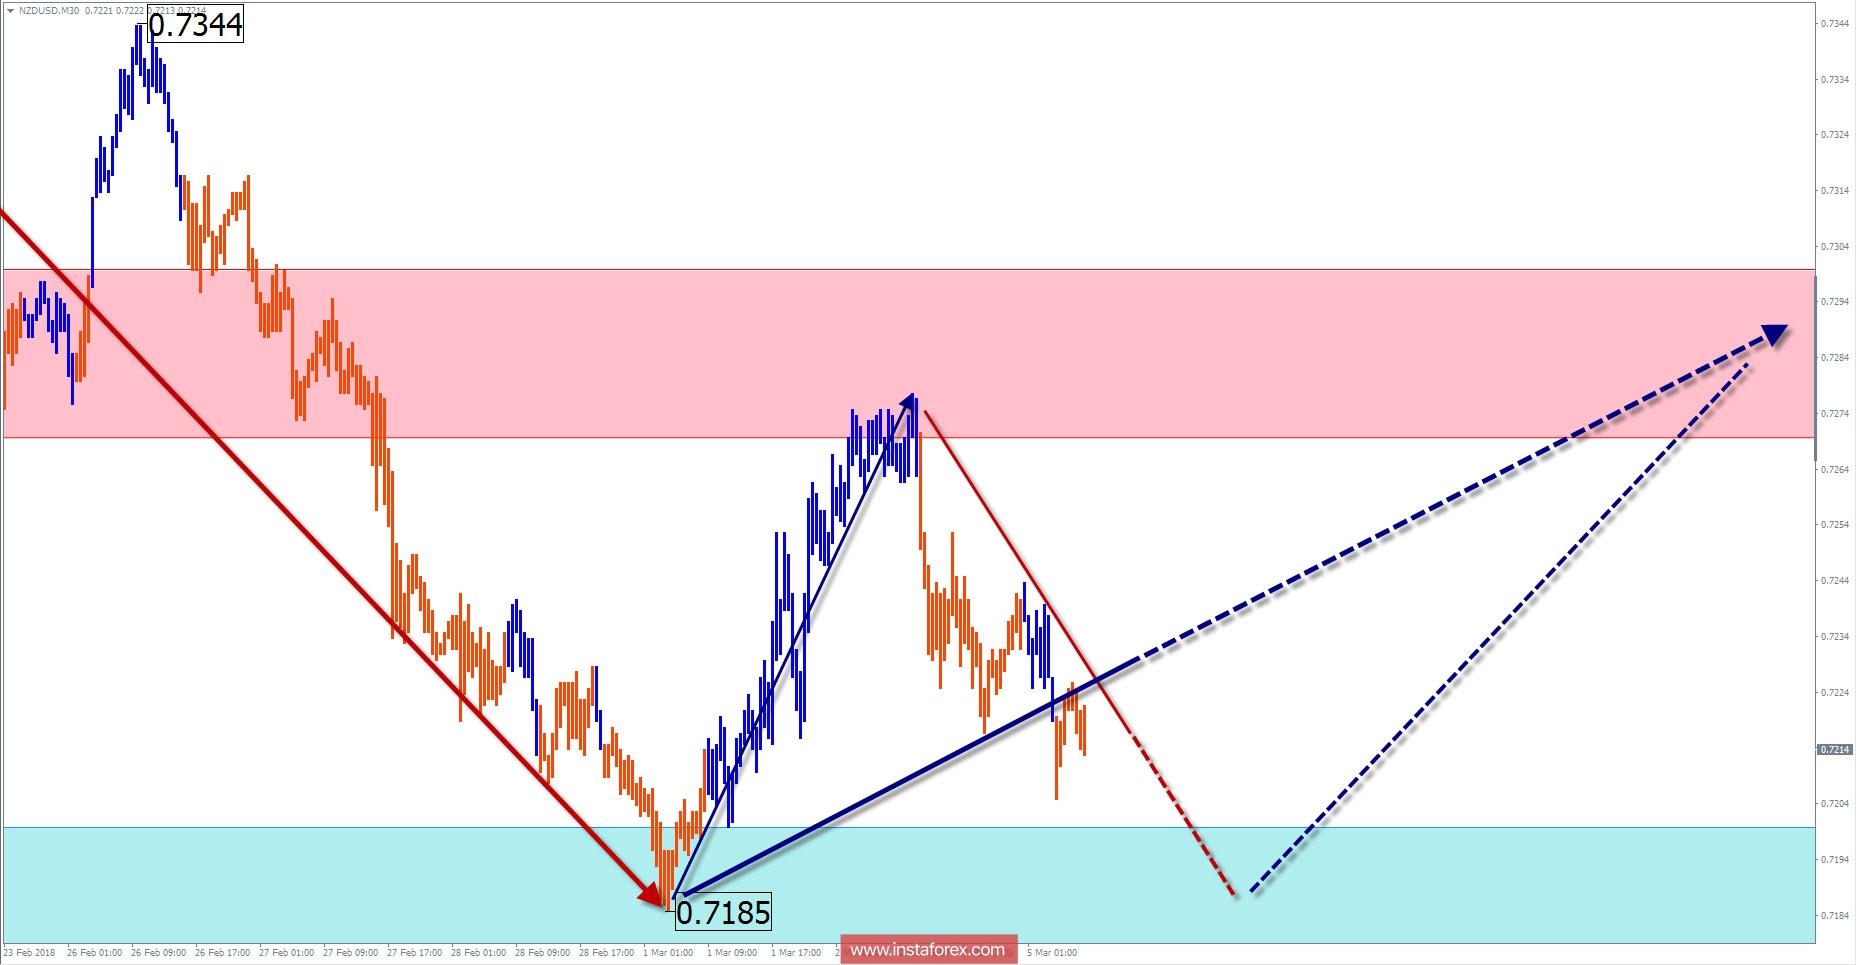
Starting by the end of January, the price of the pair moves in the lateral plane, forming a counter correction section. At the top of the price is a rather strong resistance zone, reinforced by the level of the daily chart scale. The preliminary calculation of the size of the decline implies the possibility of a downtrend within the price shape.
Today, a common flat mood is likely within the framework of the calculated counter zones. In the first half of the day, the price is expected to decline with a change in direction and then, a price increase is likely to happen.
Boundaries of resistance zones:
- 0.7270 / 0.7300
Boundaries of support zones:
- 0.7200 / 0.7170
Explanations of the figures:
For simplified wave analysis, a simple waveform is used that combines 3 parts namely A, B, and C. All types of correction are created and most of the impulses can be found in these waves. Every time frame is considered and the last incomplete wave is analyzed.
The areas marked on the graphs indicate the probability of a change in the direction of motion has significantly increased as calculated in the areas. Arrows indicate the wave counting following the technique used by the author. A solid background of the arrows signifying the structure has been formed while the dotted one means the expected wave motion.
Attention: The wave algorithm does not take into account the duration of the movement of tools in time. The forecast is not a trading signal! To conduct a bargain, you need to confirm the signals used by your trading systems.
InstaForex analytical reviews will make you fully aware of market trends! Being an InstaForex client, you are provided with a large number of free services for efficient trading.

