 Zostať
Podmienky obchodovania
Nástroje


The wave pattern of the major euro pair on the chart indicates the continuation of the current bullish trend since December 2016. This section completes a larger wave model, an "extended ascending plane". Analysis of the wave shows the incompleteness of its structure. The nearest target level is approximately in 5 price figures below the current price of the pair. Quotations of the previous months are within the wide potential reversal zone.
On the hourly scale of the chart, the strip of flat quotations formed a horizontal triangular figure "pendant". The exit will probably by the end of the month. In the coming days, one can count on the completion of the correction and the transition to an upward phase of the movement. A change in the exchange rate is expected within the framework of the nearest support, but a short break down to the next area cannot be completely ruled out.
Boundaries of resistance zones:
- 1.2650 / 1.2700
- 1.2450 / 1.2500
Boundaries of support zones:
- 1.2200 / 1.2150
- 1.1900 / 1.1850
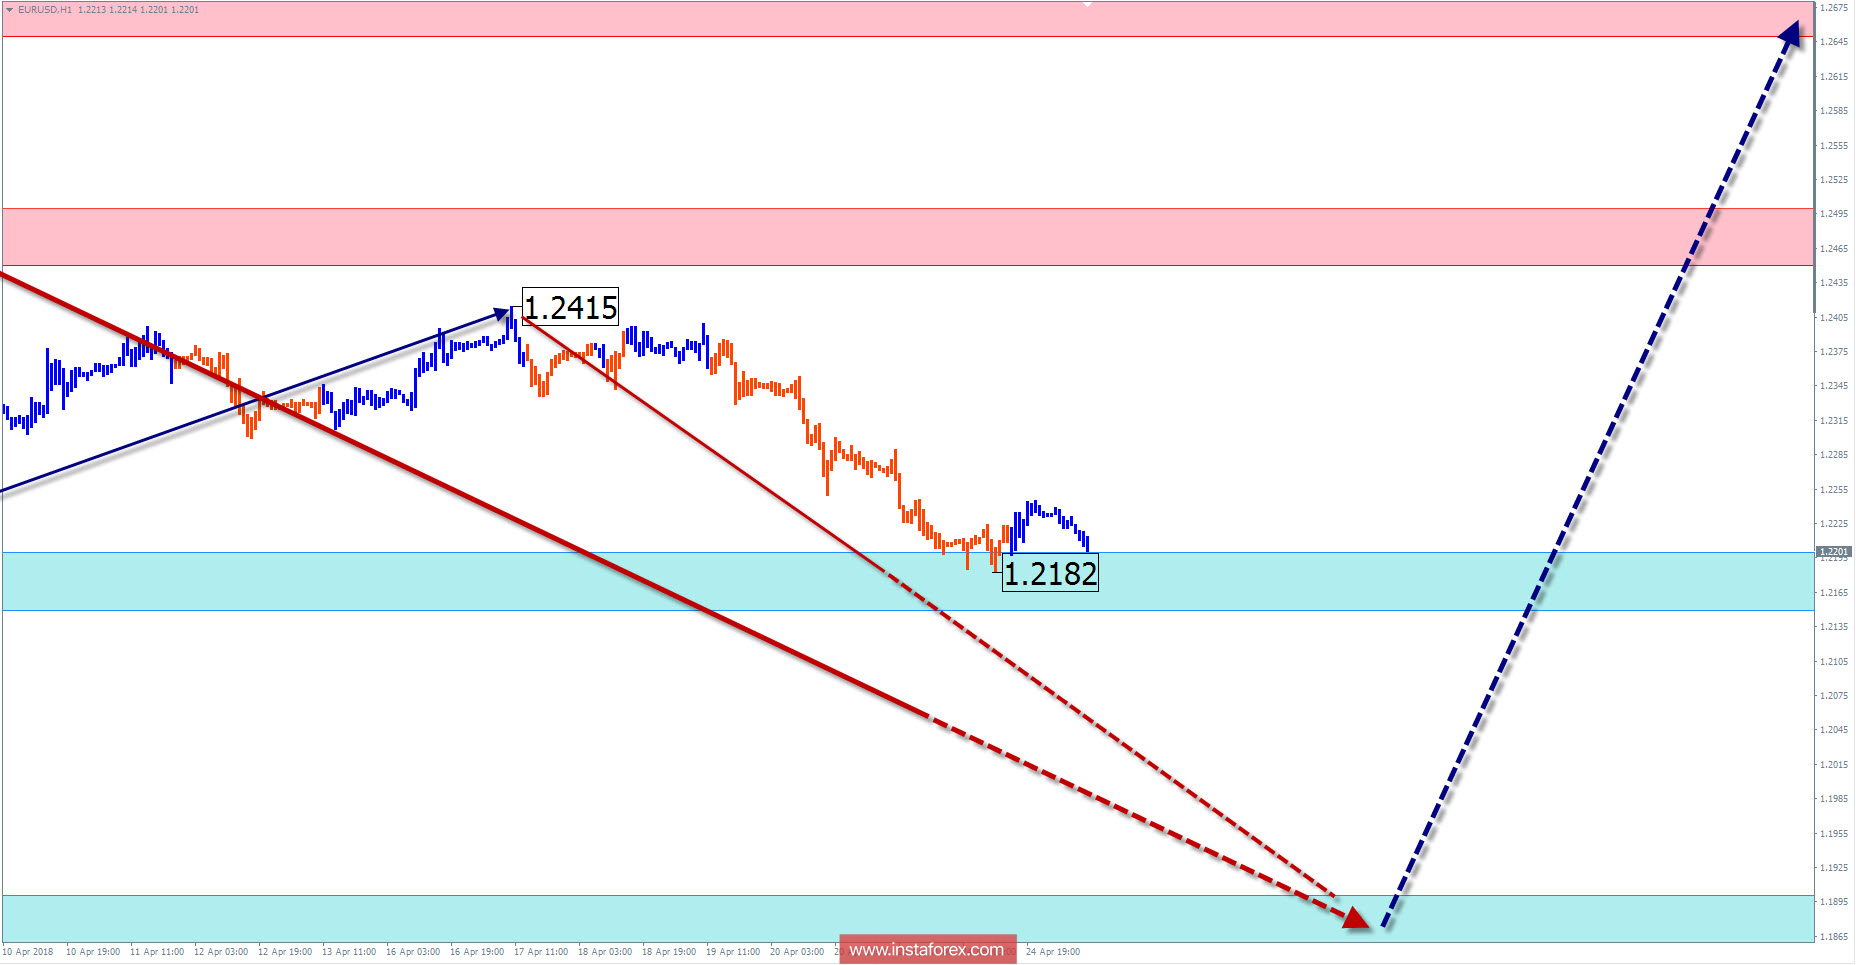
Explanations of the figures:
For simplified wave analysis, a simple waveform is used that combines 3 parts namely A, B, and C. All types of correction are created and most of the impulses can be found in these waves. Every time frame is considered and the last incomplete wave is analyzed.
The areas marked on the graphs indicate the probability of a change in the direction of motion has significantly increased as calculated in the areas. Arrows indicate the wave counting following the technique used by the author. A solid background of the arrows signifying the structure has been formed while the dotted one means the expected wave motion.
Attention: The wave algorithm does not take into account the duration of the movement of tools in time. The forecast is not a trading signal! To conduct a bargain, you need to confirm the signals used by your trading systems.
InstaForex analytical reviews will make you fully aware of market trends! Being an InstaForex client, you are provided with a large number of free services for efficient trading.


