 Zostať
Podmienky obchodovania
Nástroje


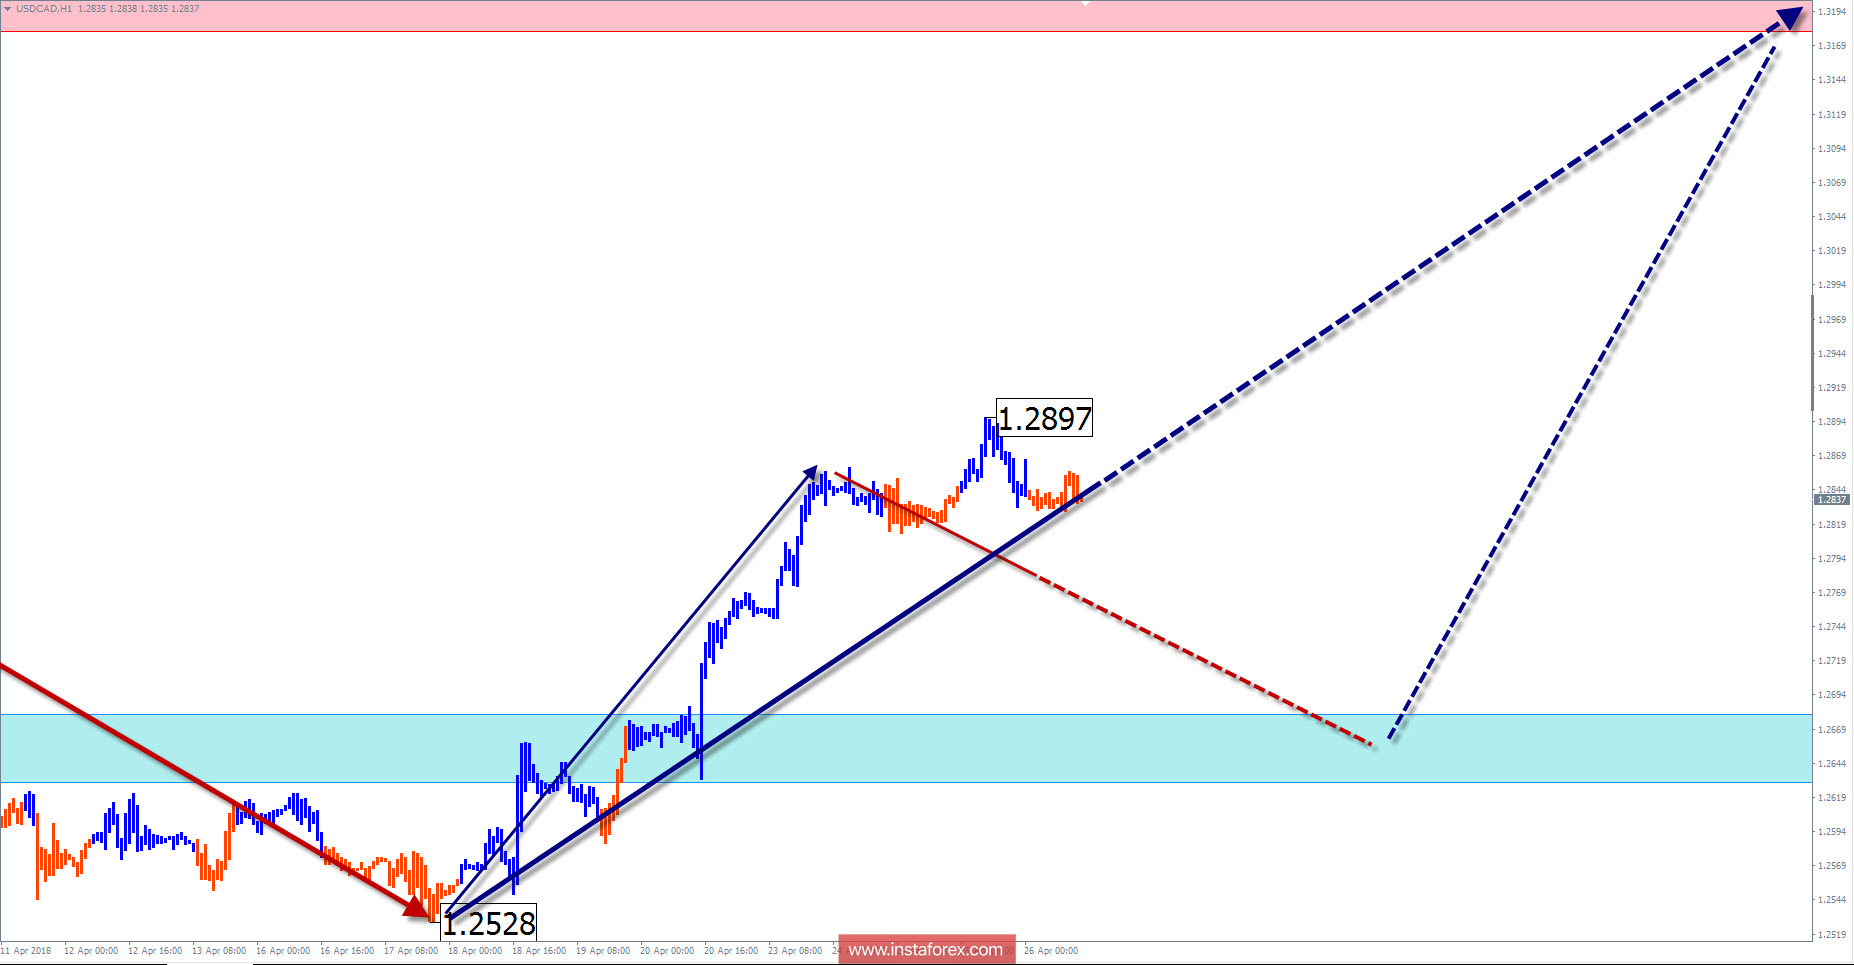
Over the past 2 years, the price of the major Canadian dollar has lost about 15% of its value. A distinctive bearish zigzag formed on the chart of the instrument. Since September last year, quotations began to form a lateral ascending corridor. The scale of this movement does not go beyond the correction of the previous wave. If the current structure continues, the scale of the movement will increase. This will mean the beginning of a new short-term trend.
For today, the last incomplete zigzag wave started at the end of January and formed the first two parts of the wave (A, B).
In the coming week, the price should work out its course towards the estimated target zone. In the coming trading sessions, a short-term depreciation is not excluded.
Boundaries of resistance zones:
- 1.3180 / 1.3230
Boundaries of support zones:
- 1.2680 / 1.2630
Explanations of the figures:
For simplified wave analysis, a simple waveform is used that combines 3 parts namely A, B, and C. All types of correction are created and most of the impulses can be found in these waves. Every time frame is considered and the last incomplete wave is analyzed.
The areas marked on the graphs indicate the probability of a change in the direction of motion has significantly increased as calculated in the areas. Arrows indicate the wave counting following the technique used by the author. A solid background of the arrows signifying the structure has been formed while the dotted one means the expected wave motion.
Attention: The wave algorithm does not take into account the duration of the movement of tools in time. The forecast is not a trading signal! To conduct a bargain, you need to confirm the signals used by your trading systems.
InstaForex analytical reviews will make you fully aware of market trends! Being an InstaForex client, you are provided with a large number of free services for efficient trading.

