 Zostať
Podmienky obchodovania
Nástroje


At the end of December last year, an example of the single European currency technical analysis in the long-term outlook in January 2018 using the Tom DeMarq sequent technique https://www.instaforex.org/en/forex_analysis/196443, showed a radical change in the bearish trend of the euro. But a few months passed before we received a second signal of this trend break and now here is an explanation why the reversal occurred not in January, but only in April.
In the classic version of the Sequence indicator, as described by DeMark himself, the turn or rather the depletion of the trend came with the 13th bar after the counter of these bars (candles) started, at which the current bar closes below the minimum of the second earlier candle. Details of this technique can be found in Jack Schwager's book Technical Analysis in the early years of the 2000s. Later, computer versions of the Sequence appeared, which very conveniently warned about the depletion and spread of the market. Computer development showed that statistically in the currency market (and not in the commodity market, under which this indicator was compiled), the trend reversal occurs more often at the 9th bar than at the 13th which reflected by the allocation of the figure "9" . Of course, the classic version of DeMarque were always be remembered, but the fundamental picture of the market showed that the turn should just about happen in December last year, which prompted the conclusion that the euro is turning on the 9th bar, as it happened before several times since 1997. In April, it showed that the turn occurred on the 13th bar and this turn was confirmed in May by launching the 1st decreasing candle. Now it's time to adjust the decline targets for the euro in the long-term.
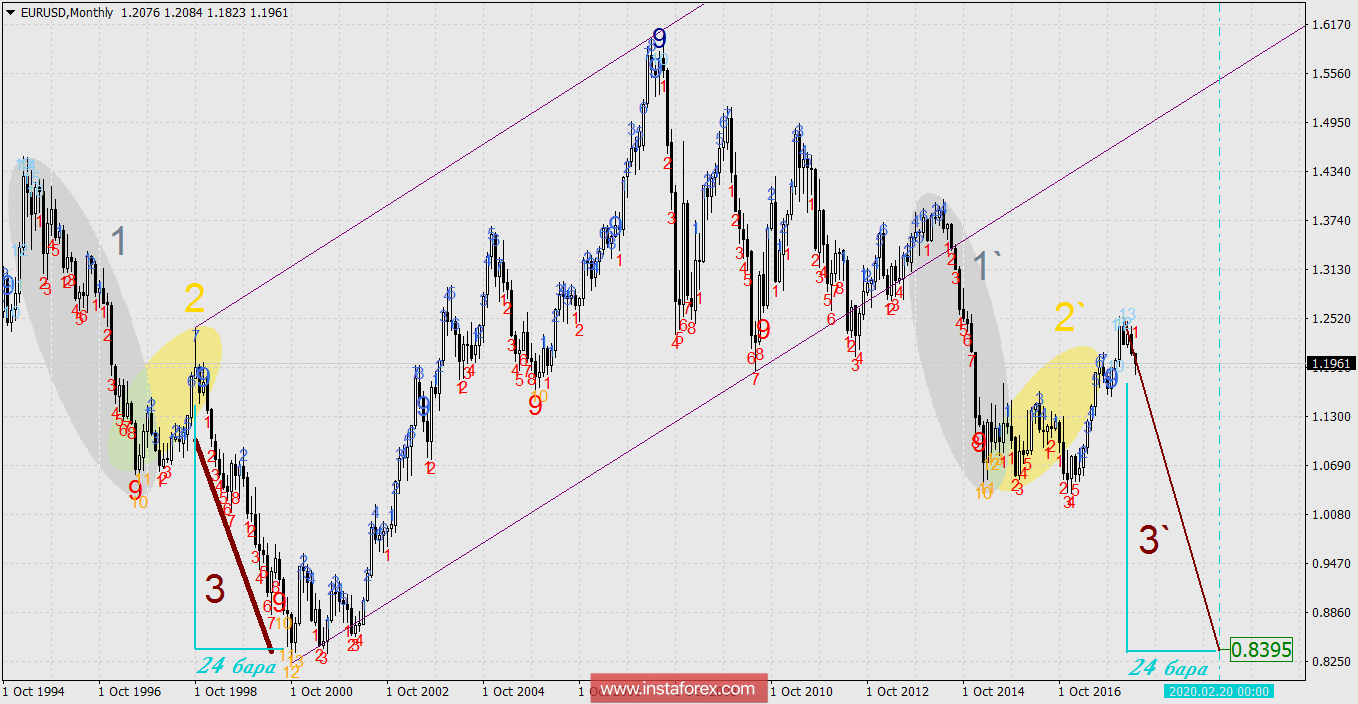
First, simply count 24 bars to the right by analogy of the fall from October 1998 to October 2000, which is indicated in the figure by the brown branch 3. Here, the Dow theory will be used to postulate that history repeats itself. The expected goal can not be determined but the time will be revealed which is February 2020.
Now let's switch to graphic constructions. In general, they are the same as they were in December last year, but with acceptable adjustments. First of all, this refers to the falling channel of a dark-lilac color (the upper border of the channel is highlighted with a thickened inscription with ticks, now it is built on three price highs). The lower boundary is paralleled from the October 2008 lows, which is the first branch of an enchanting price drop during the "mortgage" crisis.

Red inclined lines are high-speed lines of incidence, they are parallel to a thickened baseline. Crossing the speed line. The first such magnetic precision is April 2019 at a price of 1.0104. This point exactly coincides with the support of another price channel. A certain price is close to the Fibonacci level of 161.8% and exactly coincides with the lows of July 1999.
But the potential temporary decline in the euro will be identified until February 2020. Probably, there will be the second and the final price of the bearish trend. The price is given by the intersection of the timeline with the lower boundary of the brown channel and the red high-speed line - 0.8347. In connection with that, the price coincides with the lows of July 2001. The intersection of the red high-speed line with the lower border of the blue channel gives a price of 0.8518. Hence, the target range of 0.8347-0.8518 can be acquired which will include the price in February 2020.
* The presented market analysis is informative and does not constitute a guide to the transaction.
InstaForex analytical reviews will make you fully aware of market trends! Being an InstaForex client, you are provided with a large number of free services for efficient trading.


