 Zostať
Podmienky obchodovania
Nástroje


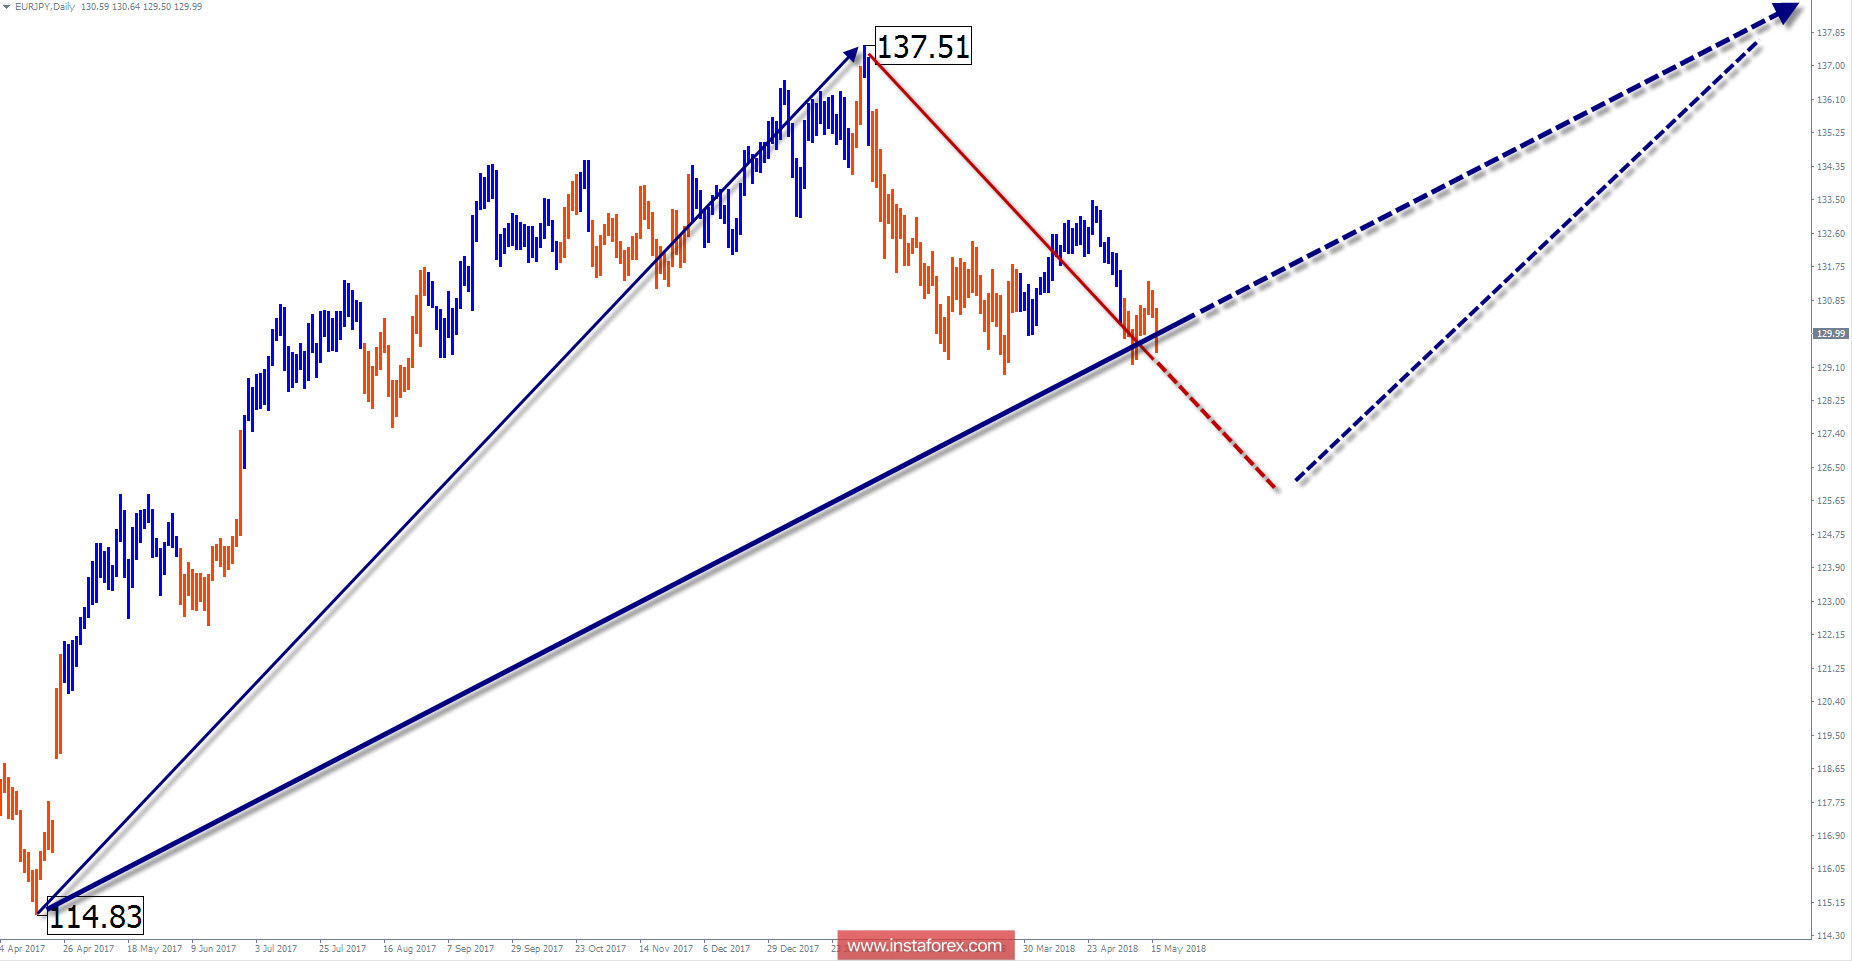
Wave picture of the chart D1:
The direction of the cross trend in recent years is set by the incomplete renewed upward wave. Above is a wide zone of potential reversal which triggered a counter correction. The structure analysis indicates the continuation of the uptrend.
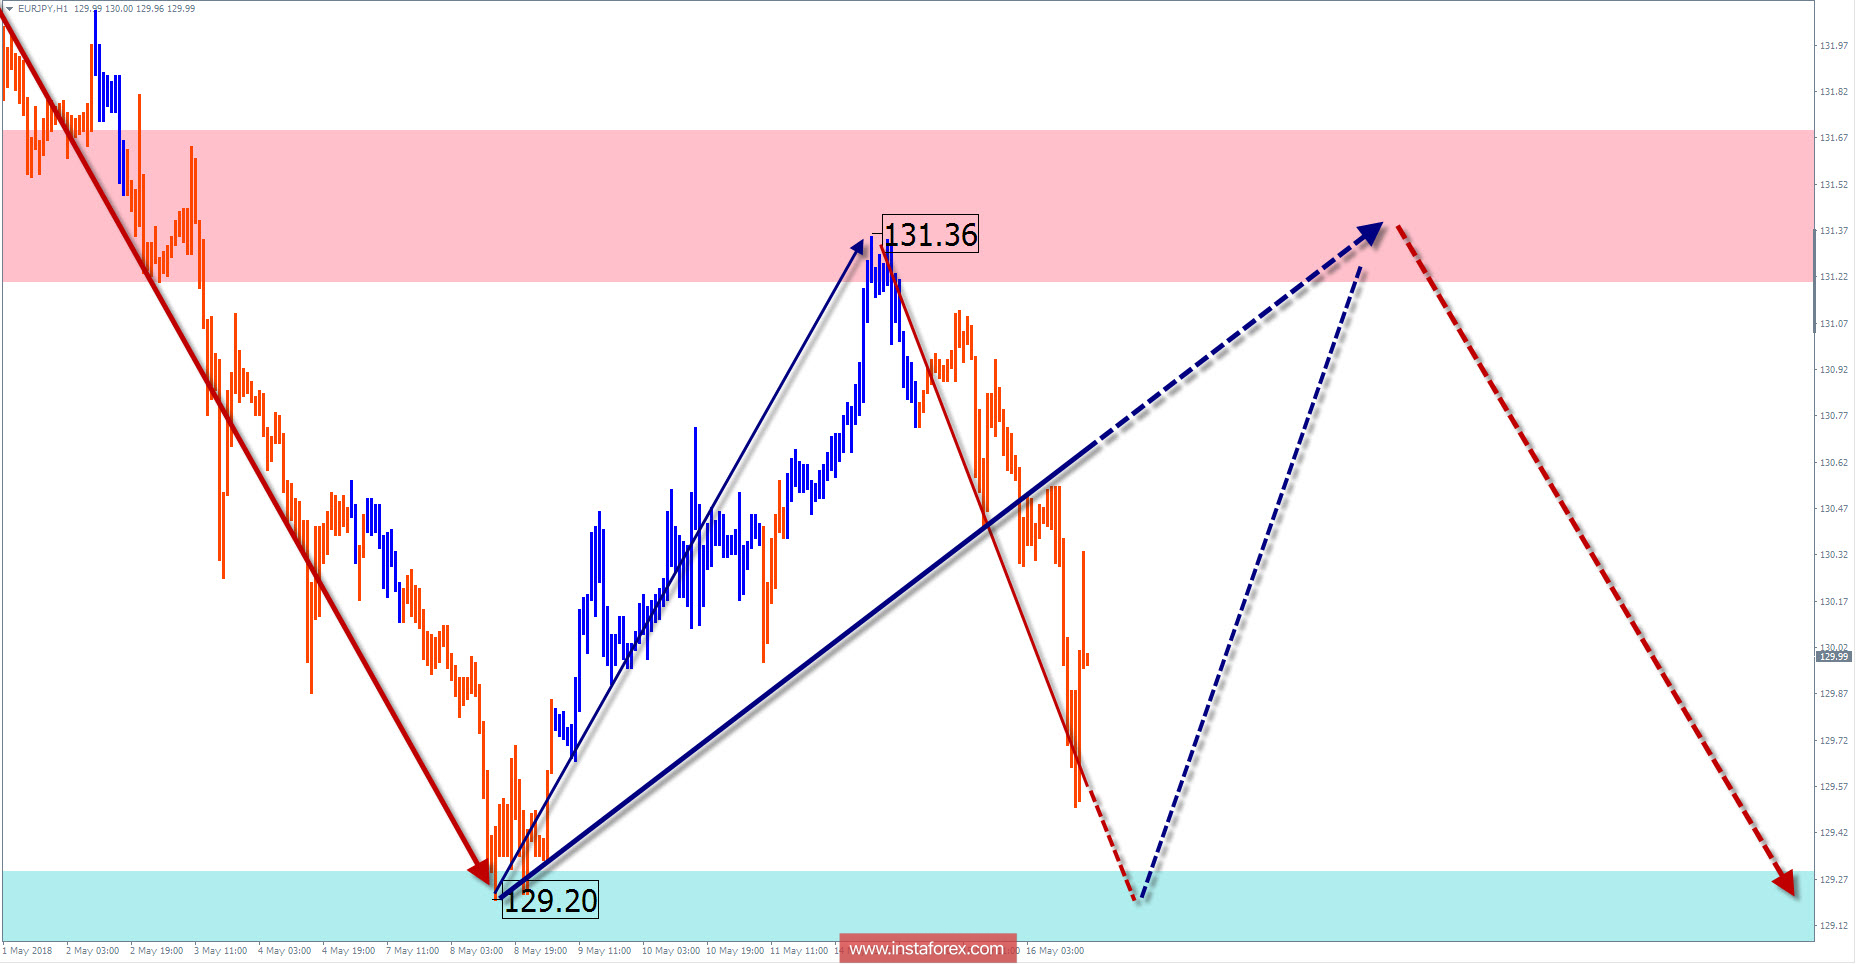
The wave pattern of the H1 graph:
On April 24, the last wave of this timeframe started lower. In a larger wave model H4, the section occupies the place of the final part (C). The wave is not complete. Preliminary calculation shows the potential target in the area of the 125th price figure.
The wave pattern of the M15 chart:
Over the past two weeks, the pair's quotations began to form an upward wave model in a zigzag pattern. The final part of the formation is not yet complete.
Recommended trading strategy:
Supporters of long-term transactions need to wait for the completion of the ascending portion and look for selling signals. Short-term traders have the opportunity to earn a price increase to the resistance zone.
Resistance zones:
- 131.20 / 131.70
Support zones:
- 129.30 / 128.80
Explanations to the figures: Simplified wave analysis uses a simple waveform, in the form of a 3-part zigzag (ABC). At each TF the last incomplete wave is analyzed. Zones show the calculated areas with the greatest probability of a turn.
Arrows indicate the wave counting according to the technique used by the author. The solid background shows the generated structure, dotted - the expected wave motion.
Attention: The wave algorithm does not take into account the duration of the tool movements in time. To conduct a trade transaction, you need confirmation signals from your trading systems!
* The presented market analysis is informative and does not constitute a guide to the transaction.
InstaForex analytical reviews will make you fully aware of market trends! Being an InstaForex client, you are provided with a large number of free services for efficient trading.


