 Zostať
Podmienky obchodovania
Nástroje


Wave picture of the D1 chart:
The bullish wave of the major "Aussie" currency pair from January 2016 sets the main direction of smaller trends. On a larger scale, this plot takes the place of correction.
The wave pattern of the H1 graph:
The main course of the inter-week trend is directed by the bearish wave of January 26. In a wave of a larger scale at H4 chart, the final part (C) forms. The upper limit of the calculated target zone is about 3 figures below the current rate.
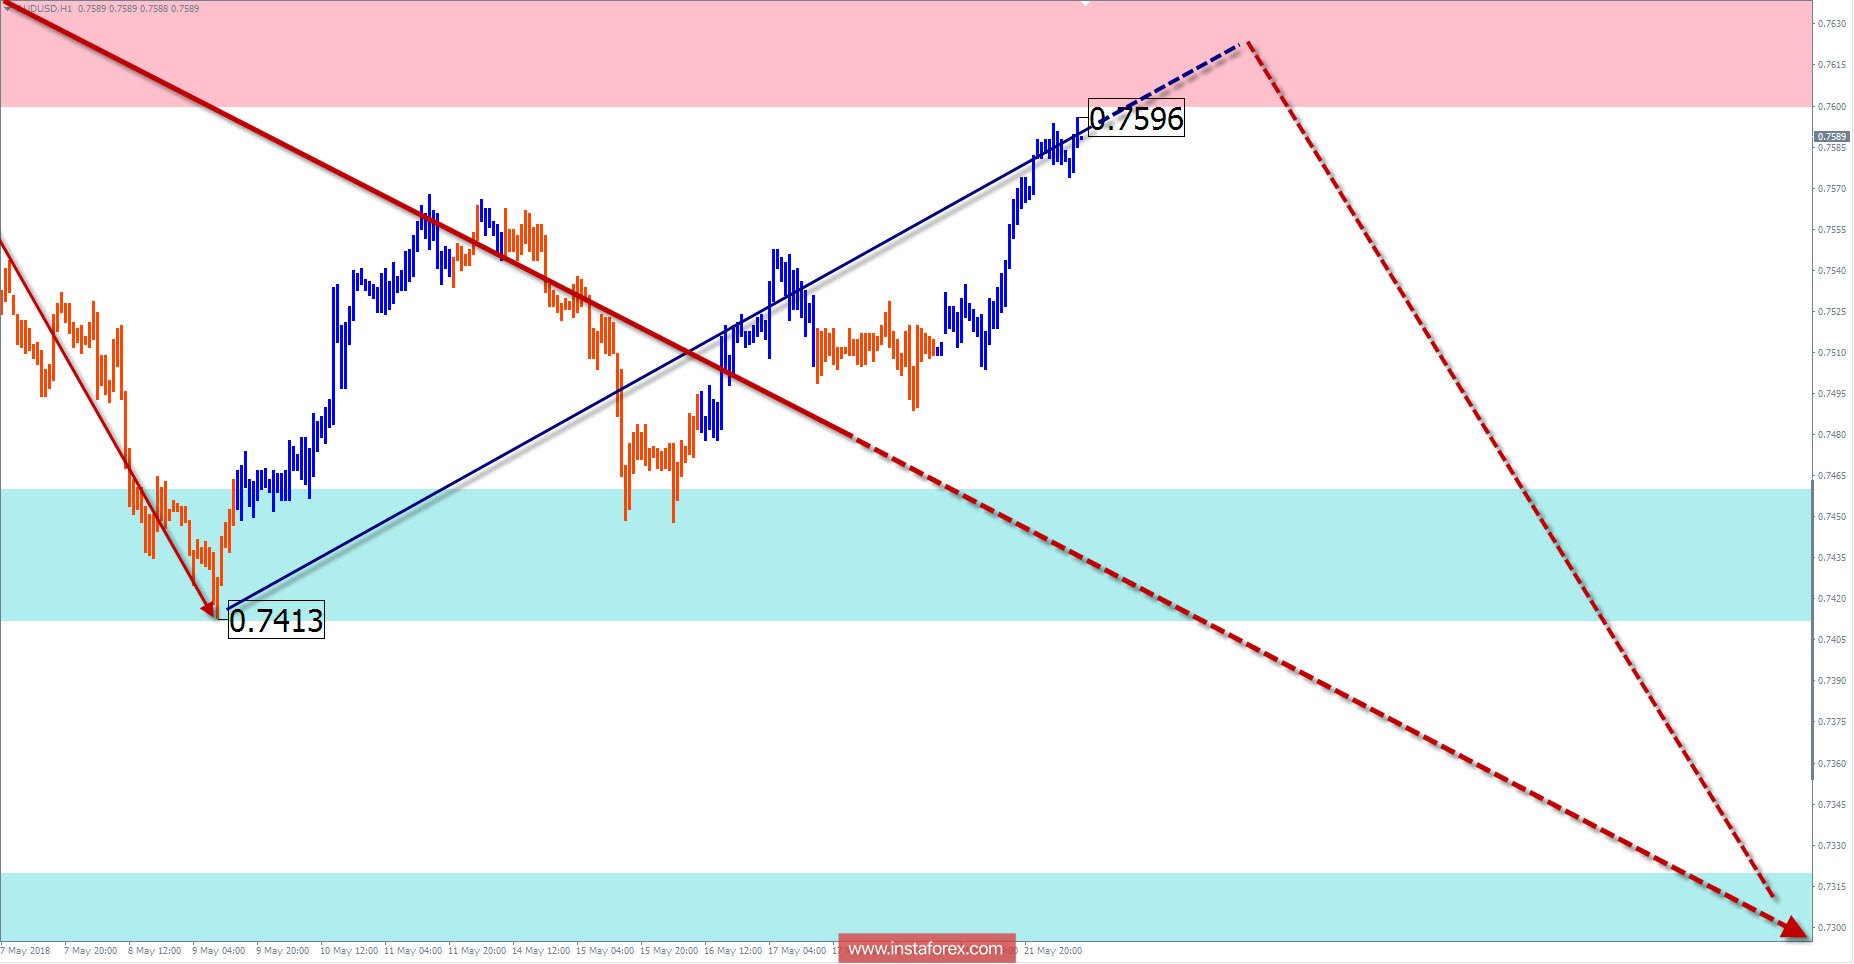
The wave pattern of the M15 chart:
Since May 9, the price of the pair is moving upward. The potential for the move is close to completion.
Recommended trading strategy:
It is better for traders trading on large scale of timeframe to wait for the completion of the entire bearish wave. For supporters of shorter periods of trade signals, selling should be sought in the area of the resistance zone.
Resistance zones:
- 0.7600 / 0.7650
Support zones:
- 0.7460 / 0.7410
- 0.7320 / 0.7270
Explanations to the figures:
A simplified wave analysis uses a simple waveform, in the form of a 3-part zigzag (ABC). The last incomplete wave for every timeframe is analyzed. Zones show the calculated areas with the greatest probability of a turn.
Arrows indicate the counting of wave according to the technique used by the author. The solid background shows the generated structure and the dotted exhibits the expected wave motion.
Attention: The wave algorithm does not take into account the duration of the tool movements in time. To conduct a trade transaction, you need to confirm the signals used by your trading systems.
InstaForex analytical reviews will make you fully aware of market trends! Being an InstaForex client, you are provided with a large number of free services for efficient trading.


