 Zostať
Podmienky obchodovania
Nástroje


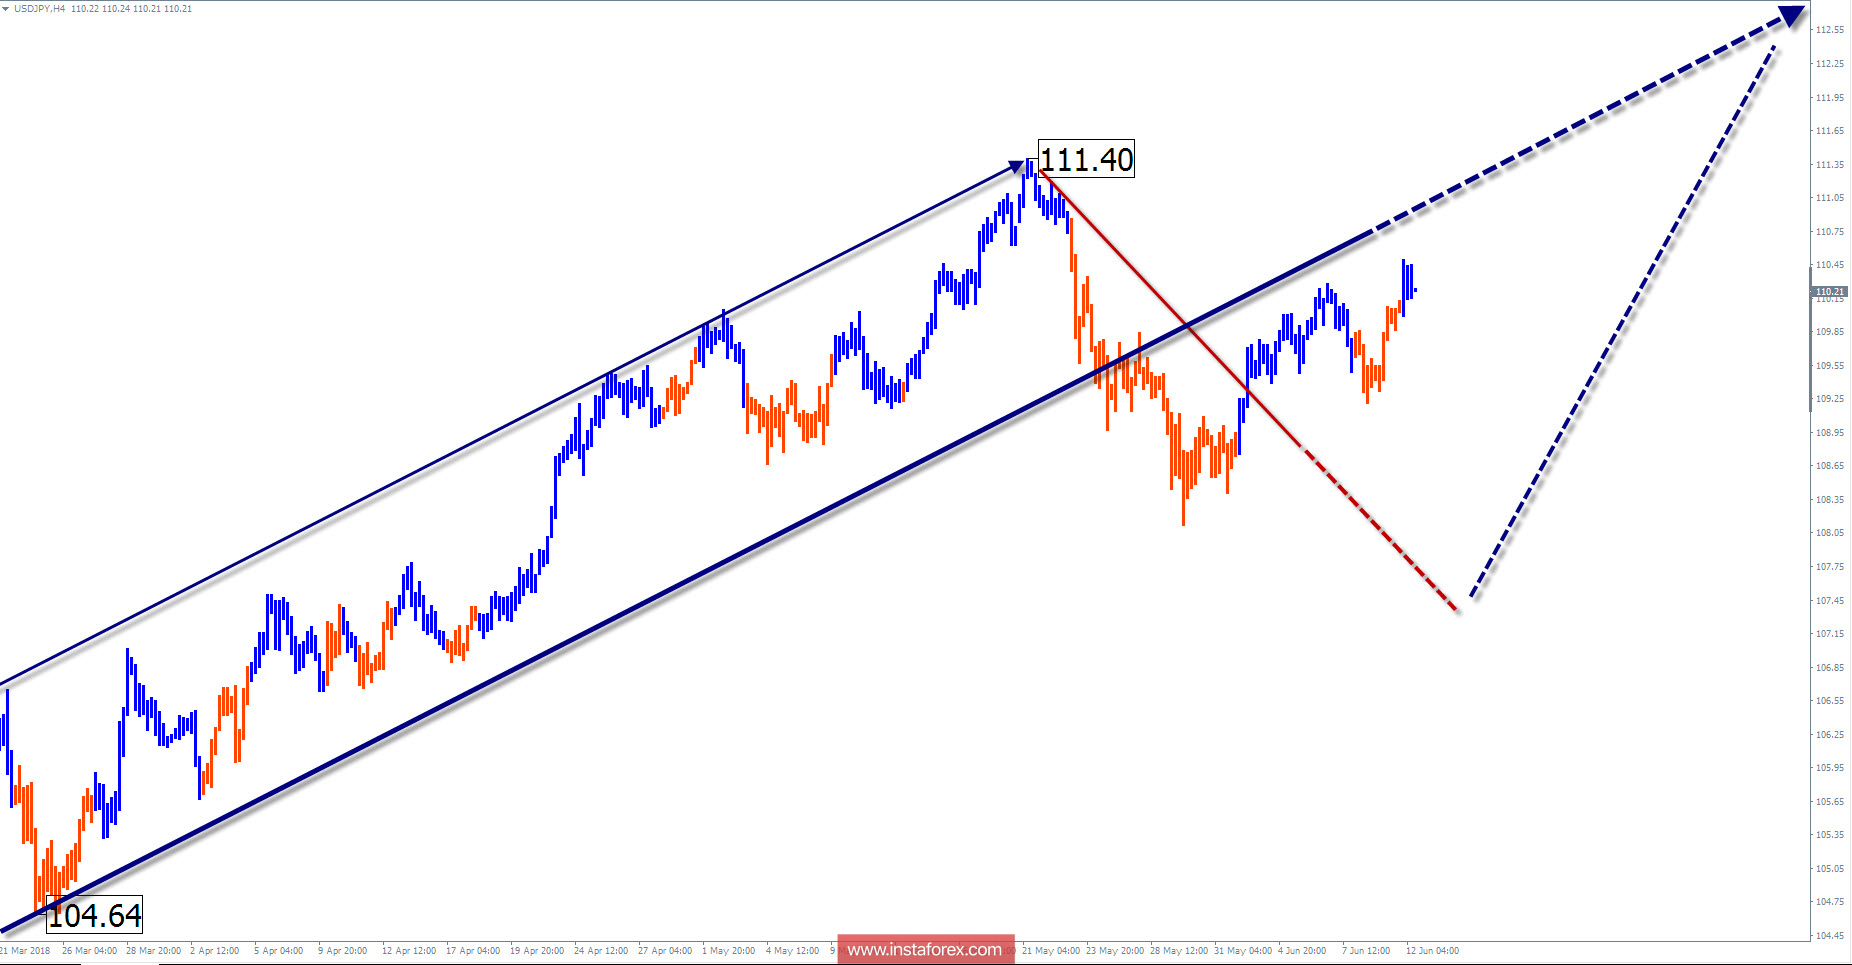
Wave picture of the chart H4:
The direction of the trend is set by the bullish wave of February 16. The wave has the wrong kind of structure. The preliminary target zone lies in 4 figures above the current rate.
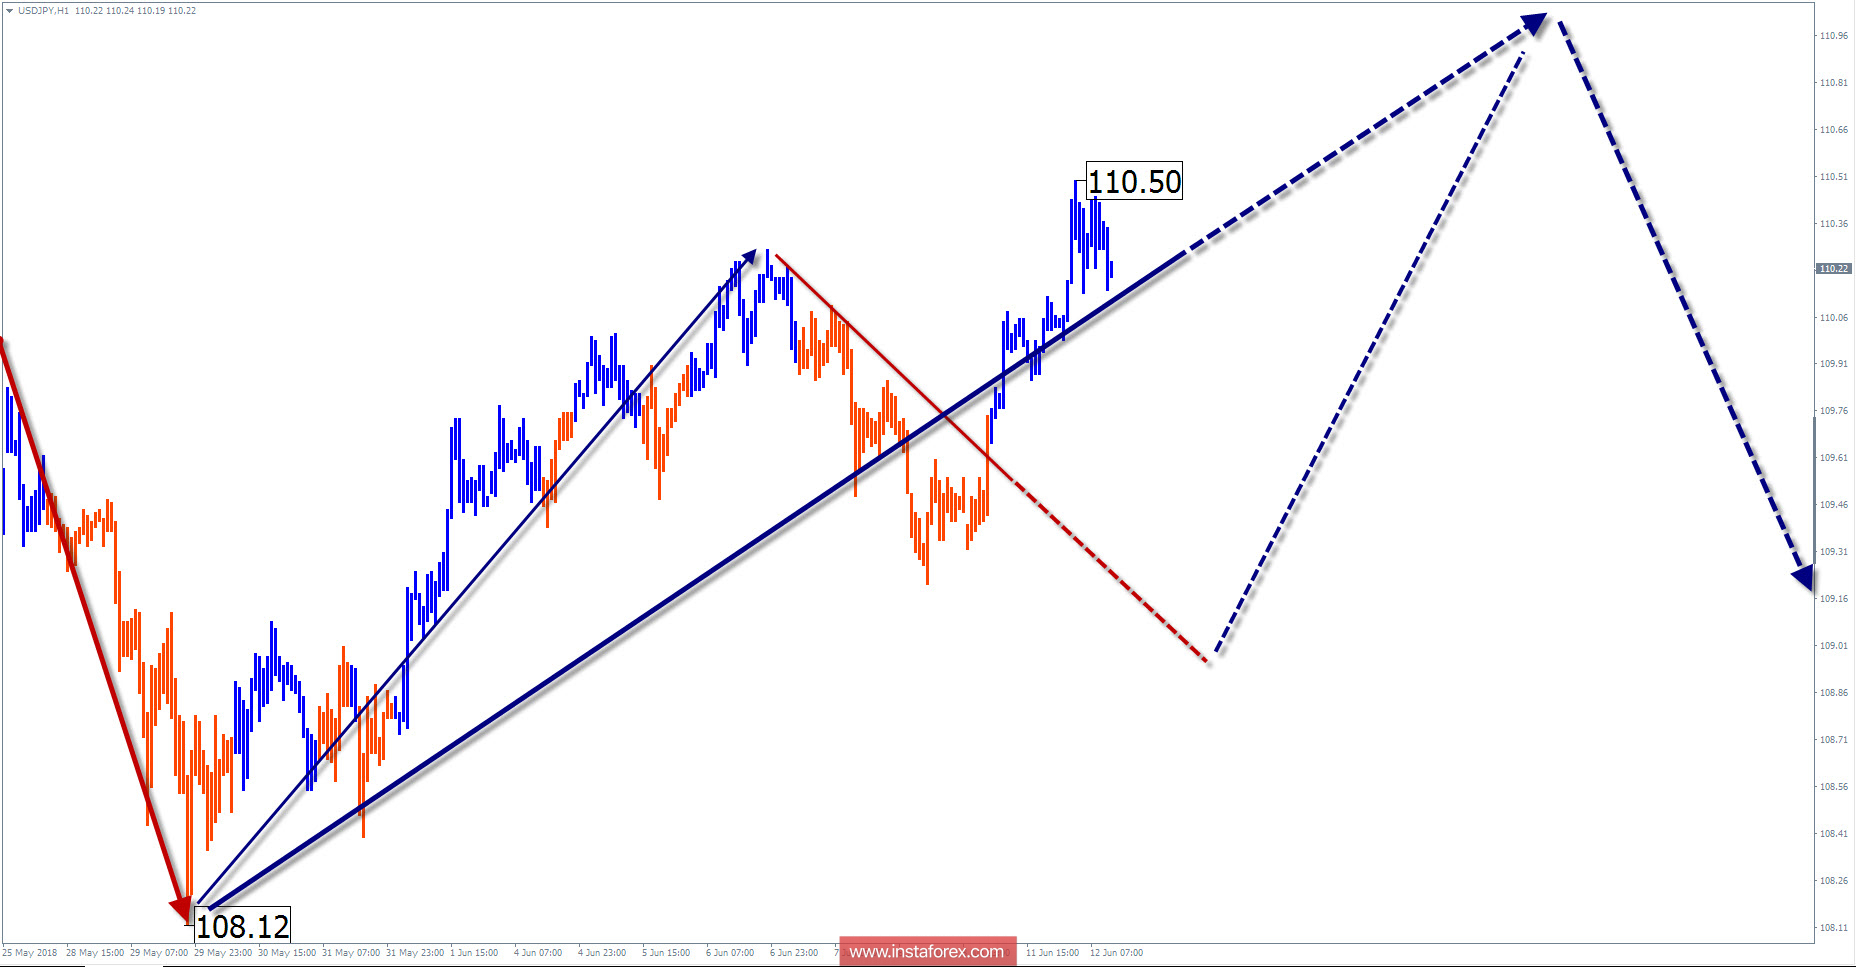
The wave pattern of the graph H1:
The descending section of May 21 forms the final part (C) of the hidden correction. After its completion, the price rise will continue.
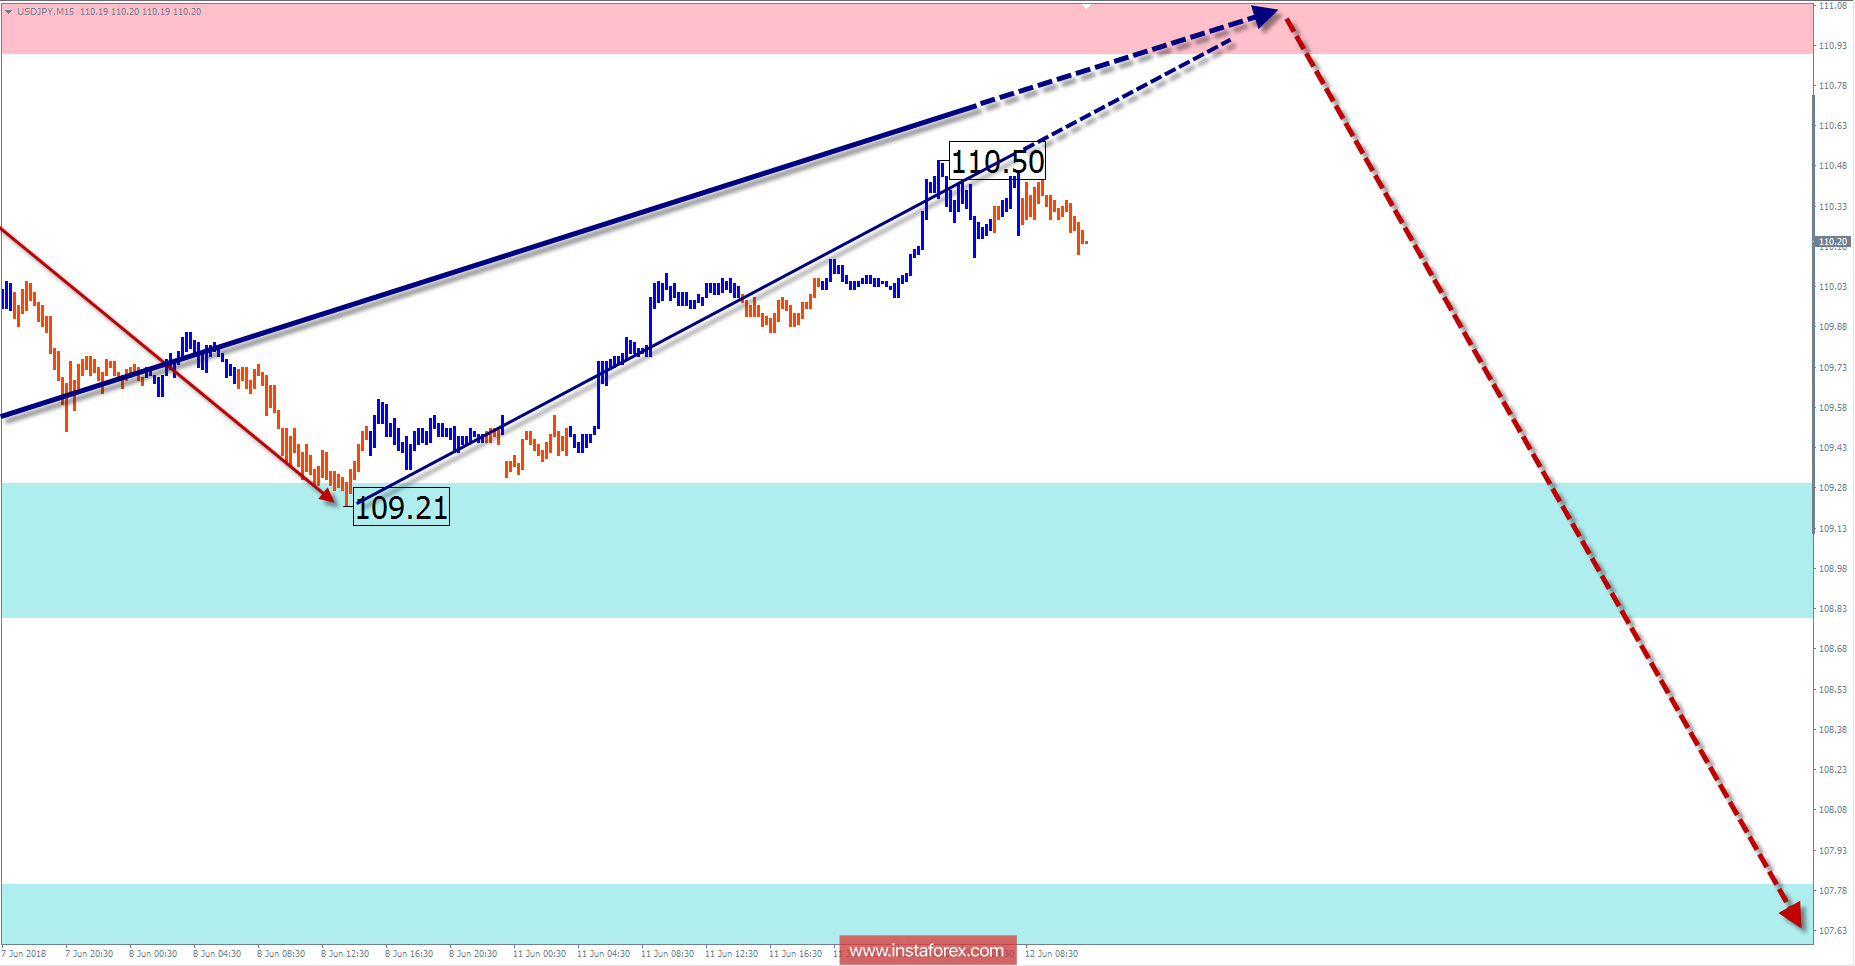
The wave pattern of the M15 chart:
The upward wave of May 29 does not have a reversal potential. The first part (A) is nearing completion, followed by a decrease in correction (B).
Recommended trading strategy:
The sales potential is limited. They can be used in intraday and interday trade. For larger scales of trade before purchases, it is necessary to wait for the completion of the entire bearish wave.
Resistance zones:
- 110.90 / 111.40
Support zones:
- 109.30 / 108.80
- 107.80 / 107.30
Explanations to the figures: In a simplified wave analysis, waves consisting of 3 parts (A-B-C) are used. In the analysis, 3 main TFs participate, on each one the last incomplete wave is analyzed. Zones show the calculated areas with the greatest probability of a turn.
Arrows indicate the wave counting according to the technique used by the author. The solid background shows the generated structure, the dotted - the expected movements.
Attention: The wave algorithm does not take into account the duration of the tool movements in time. To conduct a trade transaction, you need confirmation signals from your trading systems!
InstaForex analytical reviews will make you fully aware of market trends! Being an InstaForex client, you are provided with a large number of free services for efficient trading.


