 Zostať
Podmienky obchodovania
Nástroje

Trend analysis.
This week, the price will try to move up again to overcome the resistance line of 1.1092 (blue bold line).
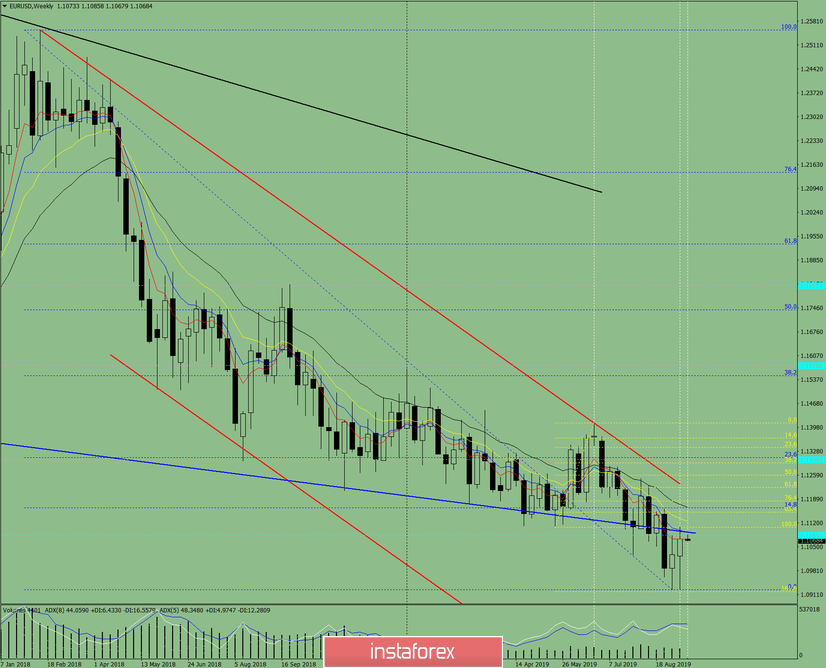
Fig. 1 (weekly chart).
Complex analysis:
- Indicator analysis – up;
- Fibonacci levels – up;
- Volumes – up;
- Candle analysis – up;
- Trend analysis – down;
- Bollinger bands – down;
- Monthly chart – up.
The conclusion of the complex analysis is an upward movement.
The overall result of calculating the candle of the EUR/USD currency pair according to the weekly chart: the price of the week is likely to have an upward trend with the absence of the first lower shadow of the weekly white candlestick (Monday – up) and the absence of the second upper shadow (Friday – up).
InstaForex analytical reviews will make you fully aware of market trends! Being an InstaForex client, you are provided with a large number of free services for efficient trading.


