 Zostať
Podmienky obchodovania
Nástroje


EUR/AUD
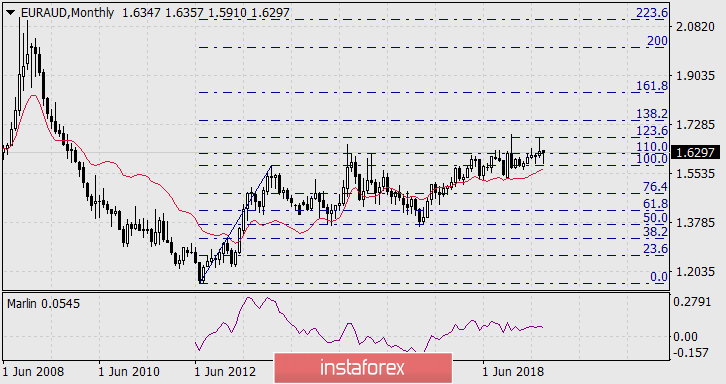
The starting point of the growing EUR/AUD trend is the distant July 2012, from the low of which the Fibonacci grid on the chart of the monthly scale accurately and correctly "laid down".
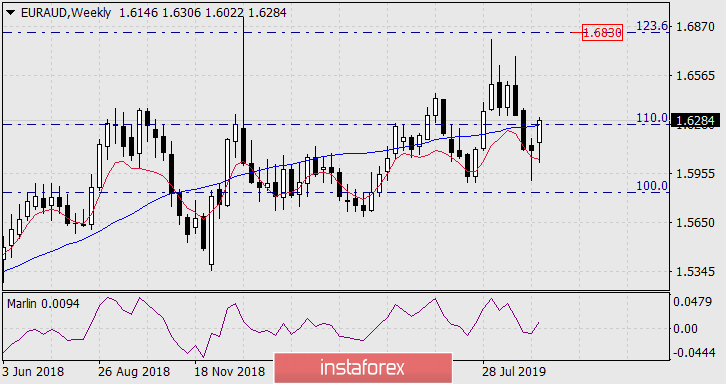
On the weekly chart, the price overcame the strong resistance formed by the Fibonacci level of 110.0% and the MACD indicator line. The signal line of the Marlin oscillator has moved into a trend growth zone. The first target of growth is the Fibonacci reaction level of 123.6% at the price of 1.6830. Consolidation above the level opens the second target of 1.7450 - the Fibonacci level of 138.2%, and this second goal coincides with the high of August 2007.
The completion of the trend is possible near the Fibonacci level of 161.8%, in the price area of 1.8440, from it there were reversals in April 2001, in October 2002, and later attempts to overcome it until mid-2003 were unsuccessful.
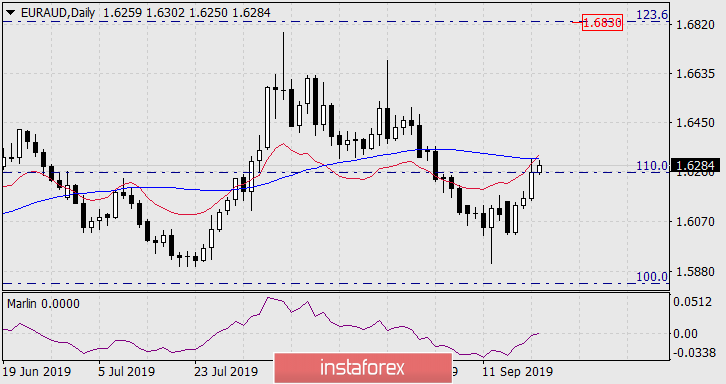
On the daily chart, the price is attacking the MACD line, the Marlin oscillator is also breaking through the boundary with the growth trend zone.
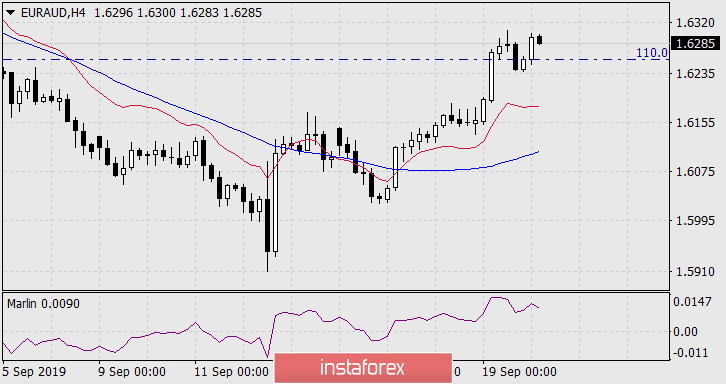
On the H4 chart, the price consolidated above the Fibonacci level of 100.0%, the output of yesterday's high will be a signal to open a long position.
InstaForex analytical reviews will make you fully aware of market trends! Being an InstaForex client, you are provided with a large number of free services for efficient trading.

