 Zostať
Podmienky obchodovania
Nástroje


Hello, traders!
Often on Fridays, I analyze the most interesting cross-rates, one of which I consider to be EUR/GBP. However, before going to the description of the technical picture of this cross, let's briefly talk about some events that affected the price dynamics of the euro/pound.
As it became known, the leaders of the European Union failed to come to a decision on further measures to counter the new type of coronavirus. The main reason was the lack of finding a compromise on debt issuance.
Economic growth in the eurozone is rapidly falling, and experts' forecasts are quite negative. Against this background, the European Central Bank (ECB) reiterated its readiness to take all necessary and possible measures to save the economy from the consequences of COVID-19. In particular, the quantitative easing (QE) program may be significantly increased, presumably by 250 billion euros. We are not talking about switching the main interest rate to negative territory yet.
Well, let's look at the EUR/GBP charts. There are some very interesting moments, and there is something to see.
Weekly
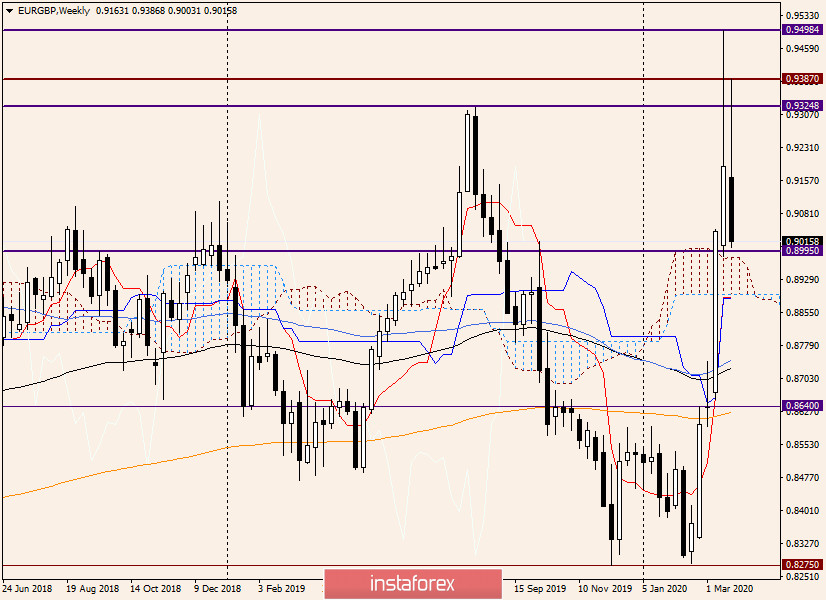
In the last review of this cross, I paid attention to the rather long upper shadow of the previous candle and assumed that this does not pass without a trace.
Trading of the current five-day period opened with a bearish gap, after which the euro bulls tried to correct the situation and resume the rise of the quote. The gap was filled and even rose to the level of 0.9387, but the players did not praise for more forces to increase, and the course turned to decline.
At the moment of writing, the current weekly candle looks like a reversal pattern "Harami", that is, it is located inside the body of the previous large white candle. If everything ends this way, there will be a signal to turn the pair in the south direction. In this case, the nearest target will be the upper border of the Ichimoku indicator cloud, which runs at 0.8980. Do not forget about the significant psychological and technical level of 0.9000, which can also provide support and influence the change of the current downward dynamics.
In general, judging by the weekly timeframe, there is a high probability of a cross reversal, but it is worth waiting for the final formation of the current weekly candle.
Daily
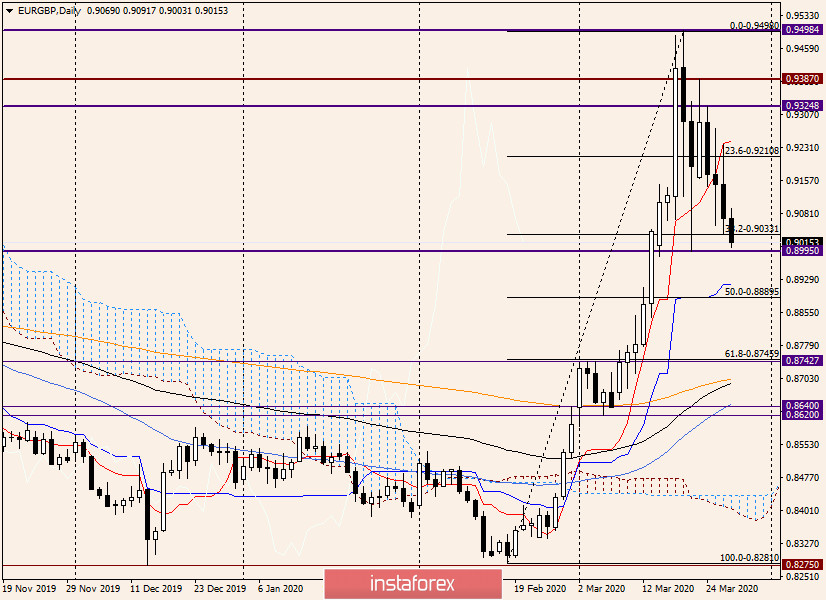
But on the daily chart, with a high probability, you can already state the reversal of the euro/pound. It all started with a candle that appeared at the end of trading on March 19. The bulls' attempts to correct the situation on the instrument were limited to the level of 0.9387, after which the bears took the initiative and pushed the quote lower and lower.
At the time of writing, the euro/pound is trading near 0.9017. If the decline continues, the pair may fall to the area of 0.8917, where the Kijun line of the Ichimoku indicator passes.
However, now the main task for the bears is to break the support of 0.8995. Only after the fact of a true breakdown of this level will the road to the Kijun line open.
Technically, everything is still going through the adjustment of the EUR/GBP cross rate. This can be seen by the stretched grid of the Fibonacci tool on the rise of 0.8281-0.9498. As you can see, the euro/pound is trading near the correction level of 38.2 Fibo from the indicated growth.
Conclusions and recommendations for EUR/GBP:
Since the weekly trading has not yet been completed, it is too early to draw unambiguous conclusions about whether this is a reversal or a change in the trend. As for me, the highest probability of a reversal is seen.
According to trading ideas, at the time of completion of the article, options for both purchases and sales are still relevant. I suggest considering buying if a reversal bullish candle (or candles) appears above the support level of 0.8995 on the 4-hour or hourly charts.
For sales, a short-term rise to the area of 0.9195 looks good, where the 50 simple moving average on the H4 chart passes. Earlier sales can be tried on a rebound to the area of 0.9120-0.9140. For those who trade at the breakout levels, you can try to sell at the breakout support of 0.8995 or after the actual breakout, on a pullback to this level.
Have a nice weekend!
InstaForex analytical reviews will make you fully aware of market trends! Being an InstaForex client, you are provided with a large number of free services for efficient trading.

