 Zostať
Podmienky obchodovania
Nástroje


Chaotic surges were observed in the market yesterday, during which the quote slowed down within the level of 1.2500. Afterwards, it formed a rebound, returning the price at more than half of the previous movement. This is because speculators reduced their short positions within the level of 1.2500, transferring their transactions into buy at low levels, thereby playing against the regularity and external background.
Analyzing the past trading day by minute, we can see that a round of short positions arose at the start of the European session, during which the quote lowered locally at the level of 1.2479. Meanwhile, at the American session, an upward spiral appeared, at which the quote quickly returned above the level of 1.2500. Afterwards, it proceeded to move downward, and the most noteworthy moment was the appearance of a dragonfly doji in the daily chart.
A dragonfly is a model with a small body [or with its absence] and a long lower shadow, which signals that the bulls are still strong, and they managed to return the quote to its original point.
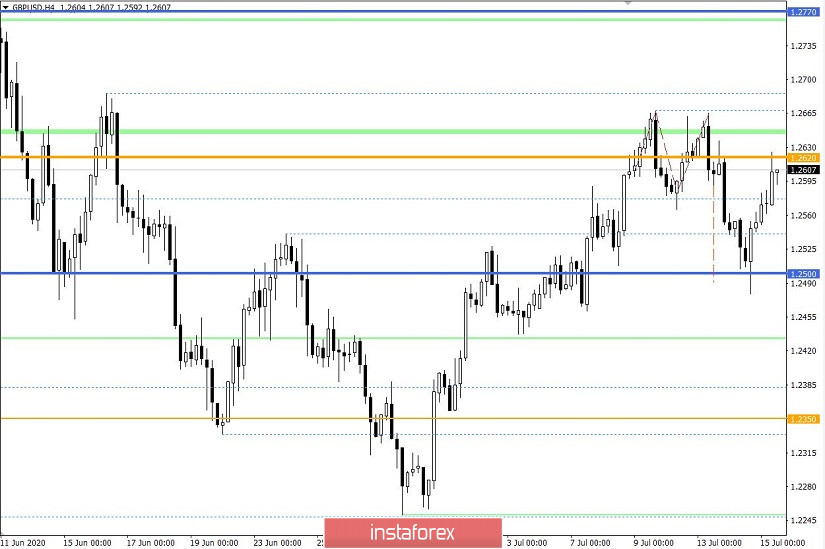
Regarding graphical analysis, we can see the full development of a double top in the four-hour period (H4), just around the level of 1.2500.
Thus, an interesting denouement is recorded in volatility, at which in daily terms, there is a slowdown of 26%, which is the lowest value since last Friday. Hourly intervals, on the contrary, reflect acceleration, precisely due to the V-shaped jump in prices.
Analyzing the trading chart in general terms (the daily period), we can see that speculative activity pulls the quote up or down, but without changing the overall picture. The movement of quotes, as before, remains horizontal for more than 3.5 months, but changes from time to time due to a fluctuation.
The news published last Friday contained important macroeconomic statistics for the United Kingdom, which locally put pressure on the pound. The monthly GDP figures for May reflected a growth of only 1.8%, much lower than the forecast of 5.0%. This indicates that the previously set plans for a V-shaped economic recovery may not happen, moreso because according to a survey conducted by Bloomnerg, the UK GDP this year could shrink by 9%, which will be the biggest decline in almost 100 years.
"As of May, the economy was still a quarter less than in February, before the impact of the pandemic became tangible to the full," said the UK Office for National Statistics.
The data for the UK does not end there. Industrial production for May was also published, which rose by 6.0%, but declined ro -20.0% in year-on-year. Volume of construction completed to 8.2% in May, much lower than the forecast of 14.5%. It also declined to -39.7% year-on-year.
In the afternoon, the long-awaited inflation data was published in the United States, where optimistic growth forecasts coincided with 0.1% -> 0.6%, which has been the most impressive change since 2012 and the first growth in four months. However, in annual terms, inflation remains below 1%.
Such data returned the demand for the US dollar, but then another news turned it back down.
This is the escalating tensions between the United States and China, which replaced up after Donald Trump announced that he had signed the law and presidential decree to hold Beijing accountable for its actions against Hong Kong. The document provides for the imposition of sanctions against foreign individuals and companies involved in violation of the British-Chinese declaration of 1984 and the main law of the PRC, which determines the position of this region as a special administrative region of the country.
At this, the Chinese Foreign Ministry reports that retaliatory measures will follow in the near future.
Today, the data on UK inflation was published, which coincided with the forecast, rising from 0.5% to 0.6%. It was not immediate, but nevertheless supported the pound.
In the afternoon, data on industrial production in the United States will be published, in which the index is expected to increase from -15.3% to -6.2%, signaling a recovery. In monthly terms, a growth of 4.0% is anticipated, which may support the US dollar.
Further development
Analyzing the current trading chart, we can see that the upward movement from the level of 1.2500 led the quote to the previously familiar coordinate of 1.2620, where a slowdown and rebound occurred on a systematic basis. Now, it is especially important to understand how much the news on Hong Kong could affect the market, in which if it subsides, the market will immediately focus on the positive statistics for the United States, with the level of 1.2620 playing an important role of resistance. But if the issue does not subside, speculation will do its job, and the resistance level of 1.2620 will soon be overcome.
Hence, if the quote consolidates lower than 1.2585, the pair will hold short positions and head towards the values 1.2565-1.2500. But an alternative scenario will occur if the quote consolidates higher than 1.2640, at which the pair will move to the value 1.2665, that is, to the high of the double top.
Indicator analysis
Analyzing the different sectors of time frames (TF), we can see that indicators of technical instruments in the minute, hour and daily periods signal "buy" due to the return of the quote in the value of 1.2620.

Volatility per week / Measurement of volatility: Month; Quarter Year
The measurement of volatility reflects the daily average fluctuation, calculated by Month / Quarter / Year.
(July 15 was built, taking into account the time the article is published)
The volatility at this current time is 75 points, which is 34% lower than the daily average. It is assumed that external news will continue to intensify activity on the market, after which volatility will accelerate.

Key levels
Resistance Zones: 1.2620; 1.2770 **; 1.2885 *; 1.3000; 1.3170 **; 1.3300 **; 1.3600; 1.3850; 1.4000 ***; 1.4350 **.
Support Areas: 1.2500; 1.2350 **; 1.2250; 1.2150 **; 1.2000 *** (1.1957); 1.1850; 1.1660; 1.1450 (1.1411); 1.1300; 1,1000; 1,0800; 1,0500; 1,0000.
* Periodic level
** Range Level
*** Psychological level
**** The article is built on the principle of conducting a transaction, with daily adjustment
Also check the hot forecast for the EUR/USD pair here, or the brief trading recommendations for both the EUR/USD and GBP/USD here.
InstaForex analytical reviews will make you fully aware of market trends! Being an InstaForex client, you are provided with a large number of free services for efficient trading.

