 Zostať
Podmienky obchodovania
Nástroje


The pair traded upward on Monday and tested the historical resistance level of 1.1912 (red dotted line). Today, the price may continue to move upward. News on the euro is expected at 09:00 UTC as per the economic calendar.
Trend analysis (Fig. 1).
The market may continue to move upward from the level of 1.1868 (closing of yesterday's daily candle) with the target at the historical resistance level of 1.1912 (blue dotted line). If this level is tested, the price may continue to move upward with the next target at the upper fractal 1.2012 (red dotted line).
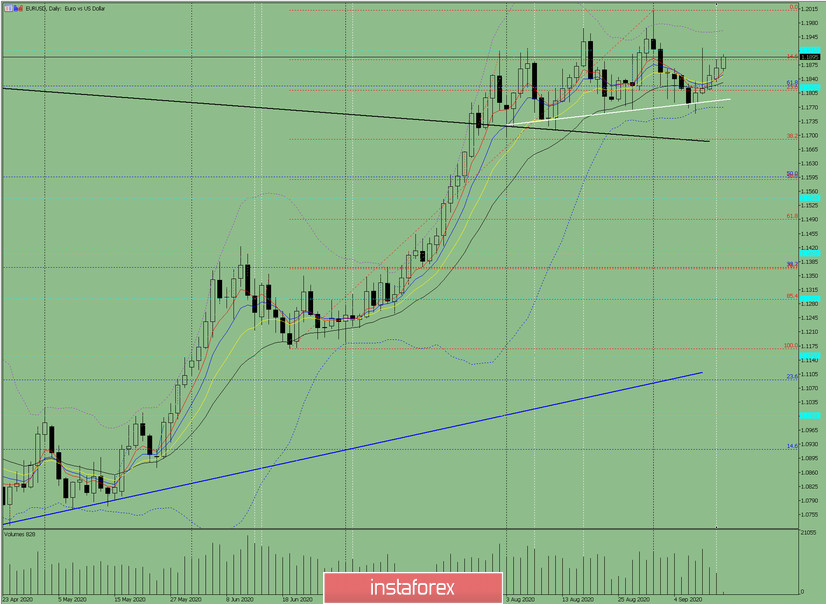
Figure: 1 (daily chart).
Comprehensive analysis:
- Indicator analysis - up;
- Fibonacci levels - up;
- Volumes - up;
- Candlestick analysis - down;
- Trend analysis - up;
- Bollinger lines - up;
- Weekly chart - up.
General conclusion:
Today, the price may move upward from the level of 1.1868 (closing of yesterday's daily candle) with the target at the historical resistance level of 1.1912 (blue dotted line). If this level is tested, the price may continue to move upward with the next target at the upper fractal 1.2012 (red dotted line).
Another possible scenario is upon reaching the historical resistance level of 1.1912 (blue dotted line), the price may move downwards with the target at the support level 1.1787 (white thick line).
InstaForex analytical reviews will make you fully aware of market trends! Being an InstaForex client, you are provided with a large number of free services for efficient trading.

