 Zostať
Podmienky obchodovania
Nástroje


Trend analysis.
The price, from the level of 1.3041 (closing of the last weekly candle), is expected to decline to the support line - 1.2944 (white bold line) this week. If this line is reached, we can continue further downwards with the goal of the lower fractal (candle from 11.10.2020) - 1.2862 (blue dotted line).
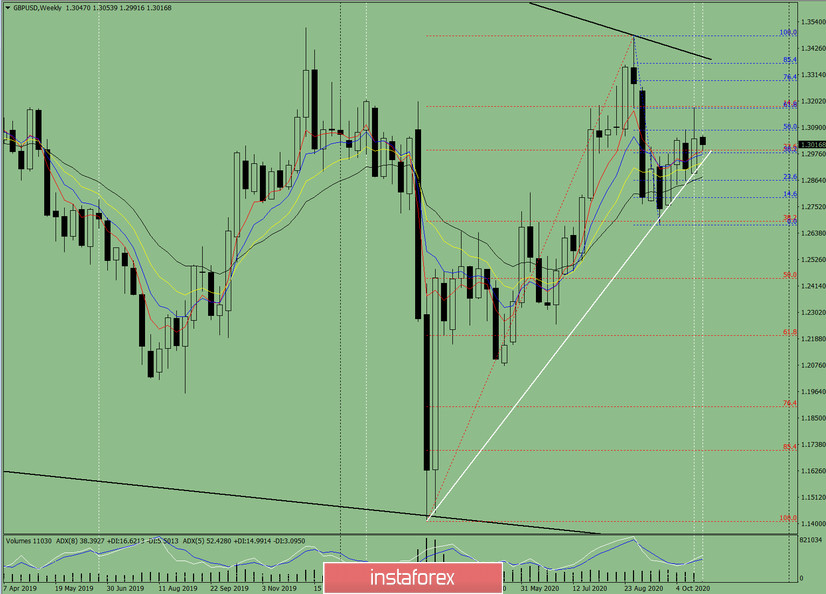
Figure: 1 (weekly chart).
Comprehensive analysis:
- indicator analysis - down;
- Fibonacci levels - down;
- volumes - down;
- candlestick analysis - neutral;
- trend analysis - up;
- Bollinger lines - up;
- monthly chart - down.
A decline can be concluded based on the comprehensive analysis.
The general result of calculating the candlestick of the GBP/USD on the weekly chart: the price will most likely decline this week without the first upper shadow of the weekly black candlestick (Monday - down) and with the second lower shadow (Friday - up).
The first downside goal is located at the support line at 1.2944 (white bold line). If this line is reached, we can continue to work downwards with the goal of the lower fractal (candle from 10/11/2020) - 1.2862 (blue dashed line).
An unlikely scenario: trading upwards to test the pullback level of 1.8% - 1.3175 (blue dashed line) after reaching the support line of 1.2944 (white thick line) is unlikely.
InstaForex analytical reviews will make you fully aware of market trends! Being an InstaForex client, you are provided with a large number of free services for efficient trading.

