 Zostať
Podmienky obchodovania
Nástroje


Hourly chart of the EUR/USD pair
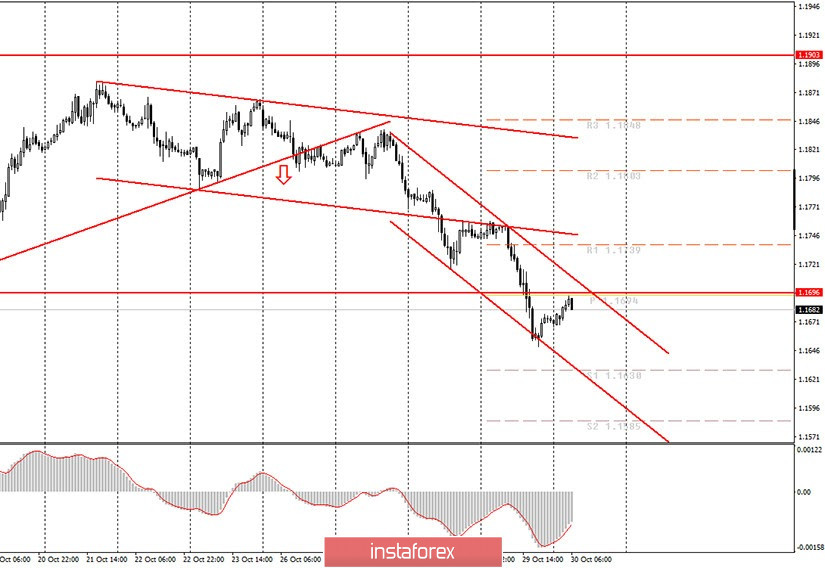
The EUR/USD pair began an upward correction last night, as we expected. Unfortunately, the movement that preceded it was so strong that even after a whole night of correction, the MACD indicator failed to recover to zero. Thus, if the euro/dollar pair wants to go back to moving down, the MACD indicator might respond late to this. However, in order to help traders, we also built a descending channel. We can say that the channel is just "one-time". It has too strong an angle of inclination, and such channels do not last for a long time. Therefore, at best, the pair will rebound off its upper border once, which will serve as a signal for new sell positions. We have two potential sell signals at once for the day. Take note that there is a third potential signal. As part of the correction, the price recovered to the 1.1696 level, which acted as the lower border of the horizontal channel for a long time. Thus, rebounding from this level can also provoke a resumption of downward movement.
As for the fundamental background, we have quite important reports to wait for. In Europe, the most important indicator of GDP (Gross Domestic Product) will be released today, which, in fact, reflects the size of the economy. Yesterday's US GDP report was very strong, which led to a sharp rise in the dollar. Traders might significantly react to today's reports as well. However, the GDP indicator itself may not be as strong as the euro buyers would like. The European economy is expected to grow 9.4% q/q in the third quarter. And in the second quarter, it lost 11.8%. But even if the third quarter's forecast was equal to the losses in the second, it still would not mean that the economy has fully recovered. This is somewhat a mathematical paradox. Take any number and subtract 31% and then add 33%. Therefore, a result of + 9.4% in the third quarter may not impress market participants. If the forecast value is exceeded by at least a few percent (which is unlikely), then the euro could rise today.The eurozone will also release its inflation rate for October, which is forecast to remain unchanged at -0.3% y/y. If this report does not turn out to be much stronger than forecasts, then it will not provide any support for the euro. Only minor reports will be published today in the US, which are unlikely to attract the attention of most traders.
Possible scenarios for October 30:
1) Buy positions on the EUR/USD pair are currently irrelevant. However, thanks to the new downward trend channel, buyers have more realistic opportunities to trade bullish in the near future. If the pair settles above the channel, then you can place buy positions while aiming for 1.1739 and 1.1803.
2) Trading for a fall remains relevant at this time, although the pair dropped 180 points in two days and corrected minimally. And so we expect a new sell signal from MACD, with which it may be quite late. Therefore, if novice traders see that MACD is very late, then you are advised to act at your own discretion. Rebounding from the 1.1696 level or the upper border of the channel can also be interpreted as a sell signal with targets at 1.1630 and 1.1585.
On the chart:
Support and Resistance Levels are the Levels that serve as targets when buying or selling the pair. You can place Take Profit near these levels.
Red lines are the channels or trend lines that display the current trend and show in which direction it is better to trade now.
Up/down arrows show where you should sell or buy after reaching or breaking through particular levels.
The MACD indicator (14,22,3) consists of a histogram and a signal line. When they cross, this is a signal to enter the market. It is recommended to use this indicator in combination with trend lines (channels and trend lines).
Important announcements and economic reports that you can always find in the news calendar can seriously influence the trajectory of a currency pair. Therefore, at the time of their release, we recommended trading as carefully as possible or exit the market in order to avoid a sharp price reversal.
Beginners on Forex should remember that not every single trade has to be profitable. The development of a clear strategy and money management are the key to success in trading over a long period of time.
InstaForex analytical reviews will make you fully aware of market trends! Being an InstaForex client, you are provided with a large number of free services for efficient trading.

