 Zostať
Podmienky obchodovania
Nástroje


The pound/dollar pair continued to rise last week and tested the cloud consisting of the historical resistance level of 1.3383 (blue dotted line) and the resistance line 1.3338 (black bold line). This week, the price will most likely pull back down.
Trend analysis
This week, the price from the level of 1.3313 (close of the last weekly candlestick) is expected to decline to the target of 1.3178 – the pullback level of 14.6% (red dotted line). If this level is reached, it is possible to further decline towards the next target of 1.3225 – the pullback level of 23.6% (red dotted line). This week's final target is the support line of 1.2991 (white thick line), from which the price can continue to decline.
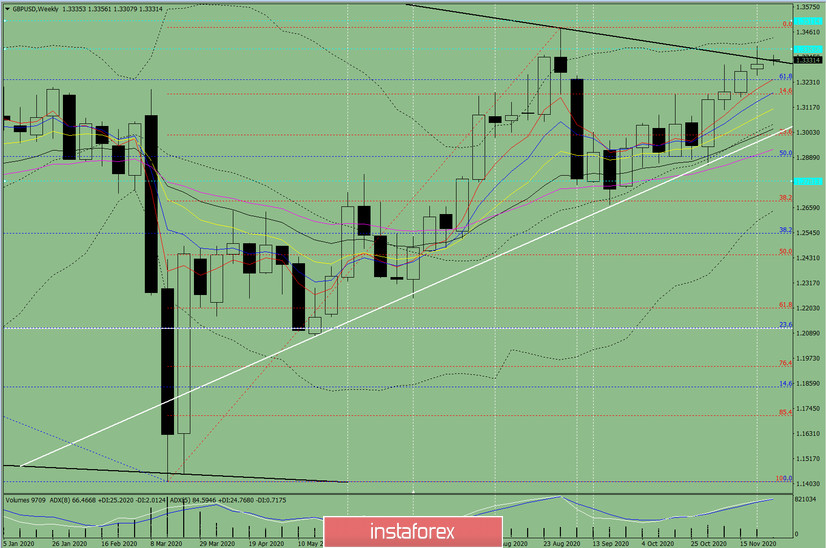
Figure 1 (weekly chart)
Comprehensive analysis:
- indicator analysis - down;
- Fibonacci levels - down;
- volumes - down;
- candlestick analysis - down;
- trend analysis - down;
- Bollinger lines - up;
- monthly chart - down.
A downward movement can be concluded based on comprehensive analysis.
The overall result of the candlestick calculation on the weekly chart: the price is likely to have a downward trend this week, with no first upper shadow of the weekly black candlestick (Monday - down) and no second lower shadow (Friday - up).
The first downside target is 1.3178 – the pullback level of 14.6% (red dotted line). If this level is reached, it is possible to continue moving downwards to the next target of 1.3125 – the pullback level of 23.6% (red dotted line). The final target for this week is the support line of 1.2991 (white thick line), from which the price may further decline.
An alternative scenario: the price may rise from the level of 1.3313 (closing of the last weekly candle) to the target of 1.3481 – the upper fractal (weekly candle from 08/30/2020). If this level is reached, it is possible to continue the upward movement.
InstaForex analytical reviews will make you fully aware of market trends! Being an InstaForex client, you are provided with a large number of free services for efficient trading.

