 Zostať
Podmienky obchodovania
Nástroje

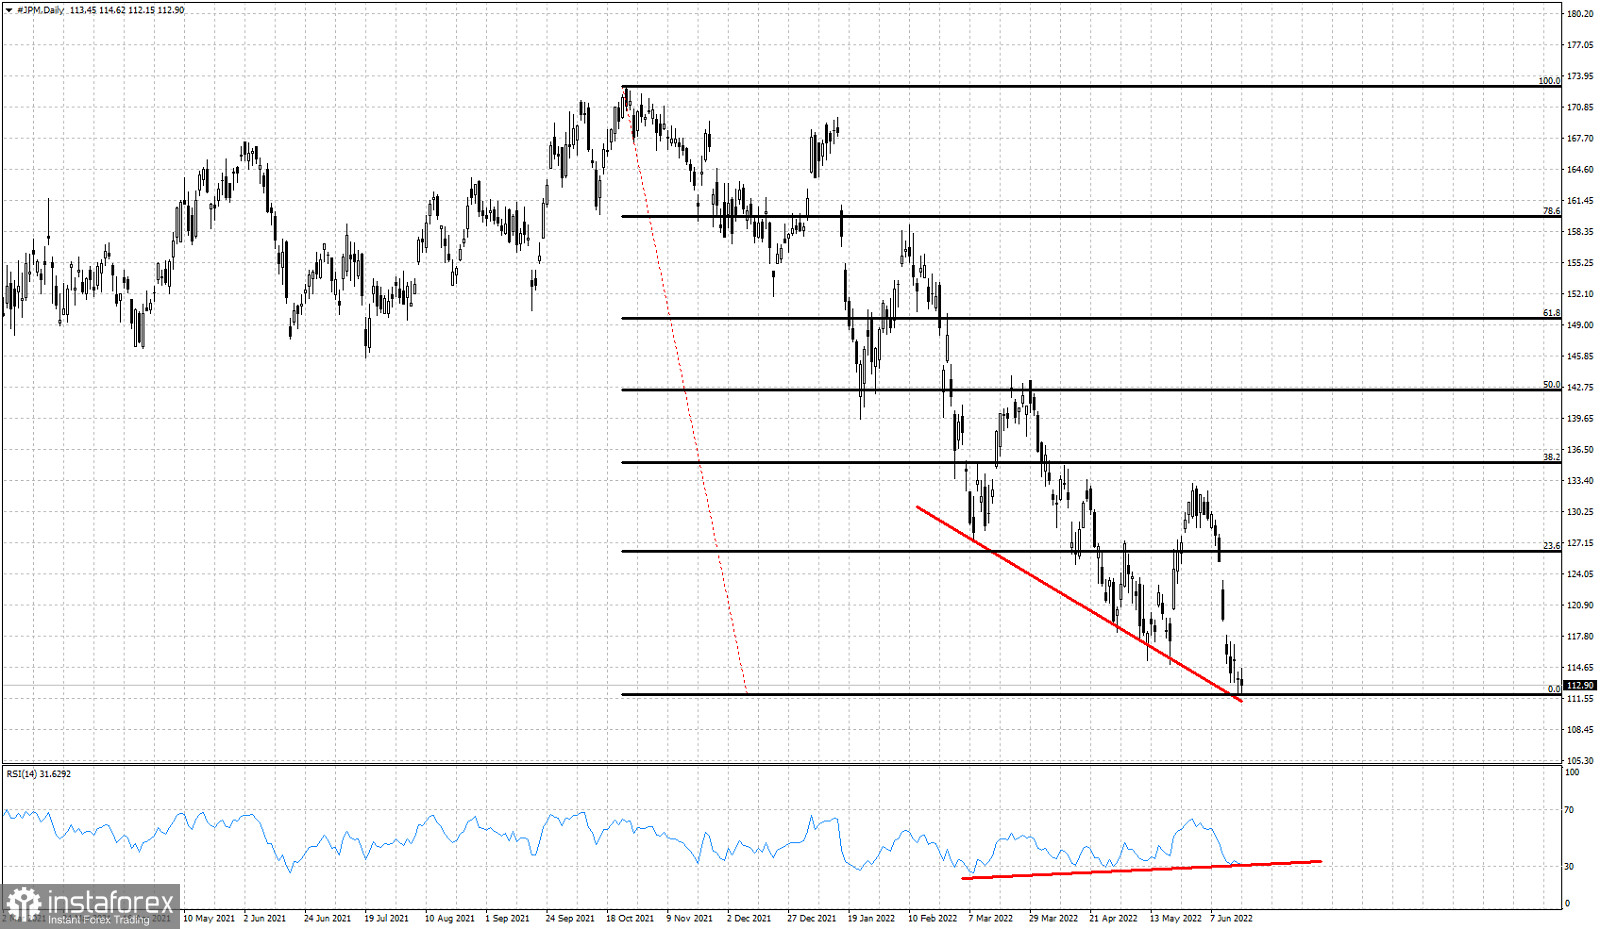
Red lines -bullish RSI divergence
Black lines- Fibonacci retracement
JPM stock price remains in a bearish trend making lower lows and lower highs. So far there is no sign of a bullish reversal. However the RSI in the Daily chart has provided us with an important bullish warning. A bullish RSI divergence is a warning to bears that the downtrend is weakening. The price has made new lower lows but not the RSI for a third time. Price justifies a reversal and a bounce higher towards the 23.6% Fibonacci retracement around $126. As long as this RSI keeps diverging, I prefer to turn neutral JPM. Remaining bearish JPM at current levels is not worth the risk reward.
InstaForex analytical reviews will make you fully aware of market trends! Being an InstaForex client, you are provided with a large number of free services for efficient trading.


