 Zostať
Podmienky obchodovania
Nástroje


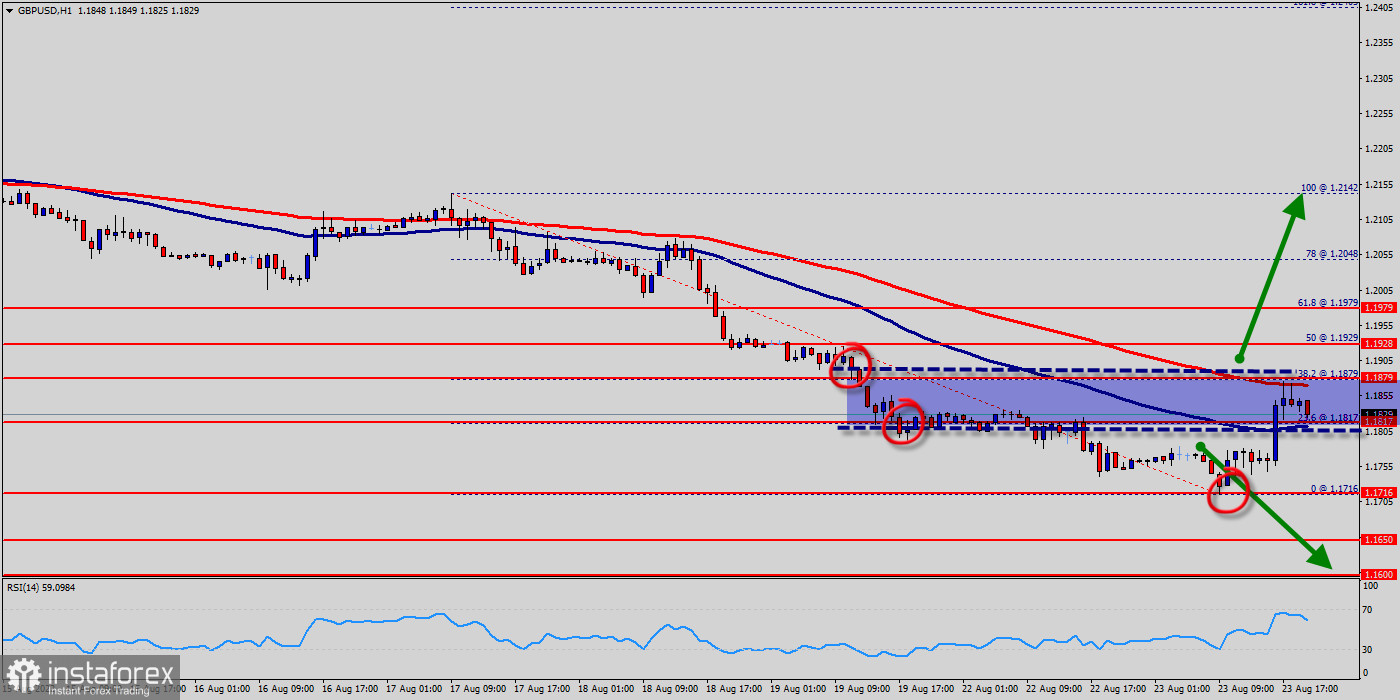
The GBP/USD pair reverses from 1.1879 and drops to multi-day lows near 1.1817 - this price formed a bottom this morning in the hourly chart. Right now, the GBP/USD pair dropped further and bottomed at 1.1716.
It then trimmed losses, rising to 1.1879. The move lower took place amid a stronger US dollar across the board. Probably, the main scenario is continued decline towards 1.1817 (sentiment level).
The GBP/USD pair broke support at the level of 1.1817 which acts as a resistance now. According to the previous events, the GBP/USD pair is still moving between the levels of 1.1817 and 1.1716.
Immediate support is seen around 1.1817. A clear break below that area could lead price to the neutral zone in the nearest term. Price will test 1.1716, because in general, we remain bearish on August 23th, 2022.
Therefore, we expect a range of 101 pips in coming hours (before the end of session). The trend is still below the 100 EMA for that the bearish outlook remains the same as long as the 100 EMA is headed to the downside.
Hence, the price spot of 1.1879 remains a significant resistance zone. Since the trend is below the 38.2% Fibonacci level (1.1879), the market is still in a downtrend.
Today, on the one-hour chart, the current drop will remain within a framework of correction. If the pair fails to pass through the level of 1.1879 (major resistance), the market will indicate a bearish opportunity below the strong resistance level of 1.1879. Since there is nothing new in this market, it is not bullish yet.
Overall, we still prefer the bearish scenario. Consequently, there is a possibility that the GBP/USD pair will move downside.
The structure of a fall does not look corrective. In order to indicate a bearish opportunity below 1.1879, sell below 1.1879 with the first target at 1.1716.
Besides, the weekly support 2 is seen at the level of 1.1650. The market will decline further to 1.1600. This would suggest a bearish market because the RSI indicator is still in a negative area and does not show any trend-reversal signs.
The pair is expected to drop lower towards at least 1.1600 in order to test the third support (1.1600) in coming days.
However, traders should watch for any sign of a bullish rejection that occurs around 1.1979.
InstaForex analytical reviews will make you fully aware of market trends! Being an InstaForex client, you are provided with a large number of free services for efficient trading.

