 Zostať
Podmienky obchodovania
Nástroje


Trend analysis
This month, the price is expected to increase from the level of 1.3470 (closing of the September monthly candlestick) to the target of 1.3620 – the pullback level of 76.4% (red dotted line). After testing it, the upward movement may continue to the next upward target of 1.3741 – the historical resistance level (blue dotted line).
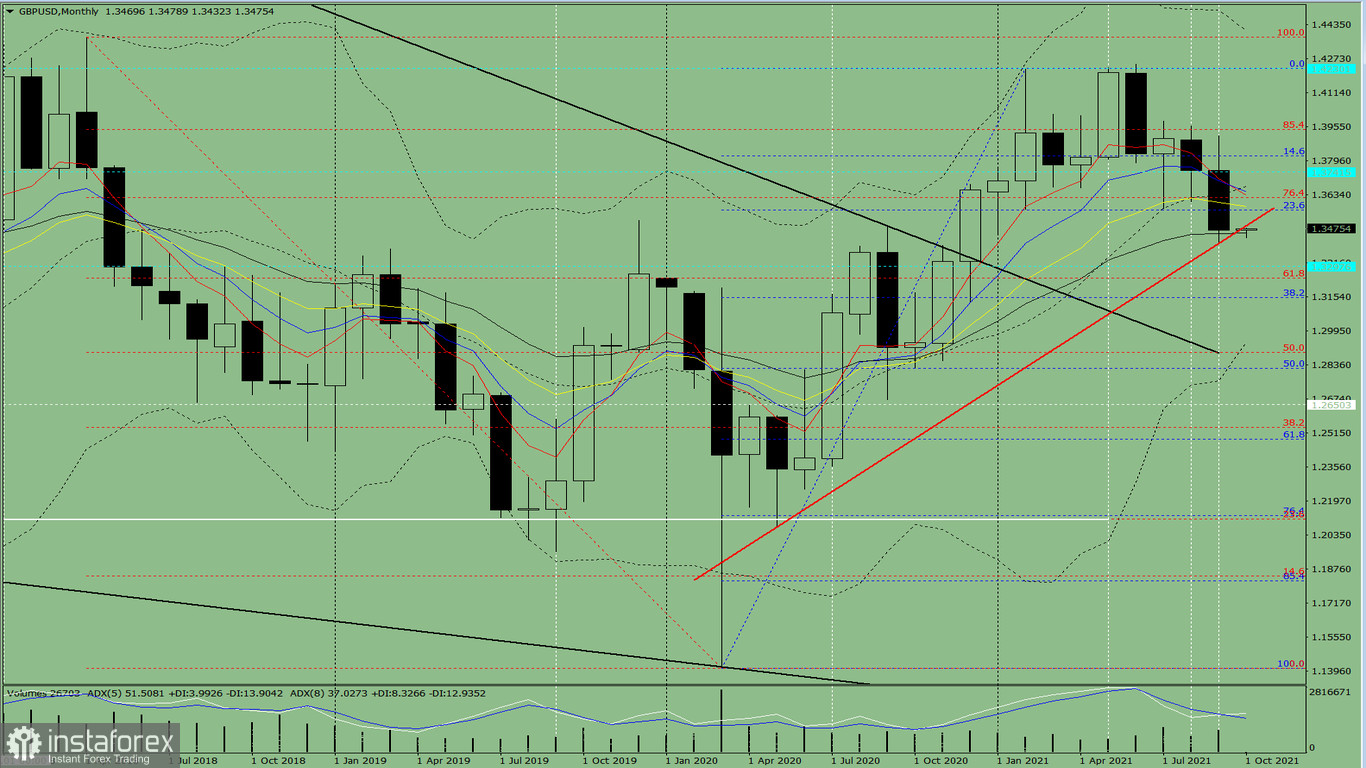
Figure 1 (monthly chart)
Indicator analysis:
An upward movement can be concluded based on a comprehensive analysis.
The overall result of the candlestick calculation based on the monthly chart: the price will most likely move in an upward trend, without the first lower shadow (the first week of the month is white) and with the second upper shadow (the last week is black) in the monthly white candlestick.
Generally, the price from the level of 1.3470 (closing of the September monthly candlestick) is expected to rise to the target of 1.3620 – the pullback level of 76.4% (red dotted line). If this level is tested, it may further rise to the next upward target of 1.3741 – the historical resistance level (blue dotted line).
As an alternative, the price from the level of 1.3470 (closing of the September monthly candlestick) may fall to the target of 1.3150 – the pullback level of 38.2% (blue dotted line). After testing this level, an upward movement is possible.
InstaForex analytical reviews will make you fully aware of market trends! Being an InstaForex client, you are provided with a large number of free services for efficient trading.


