 Zostať
Podmienky obchodovania
Nástroje


Trend analysis
The price from the level of 1.1442 (closing of the last weekly candle) may start rising this week to the target of 1.1554 – the pullback level of 14.6% (blue dotted line). If this level is broken upward, it may further rise to the target of 1.1628 – the pullback level of 23.6% (blue dotted line).
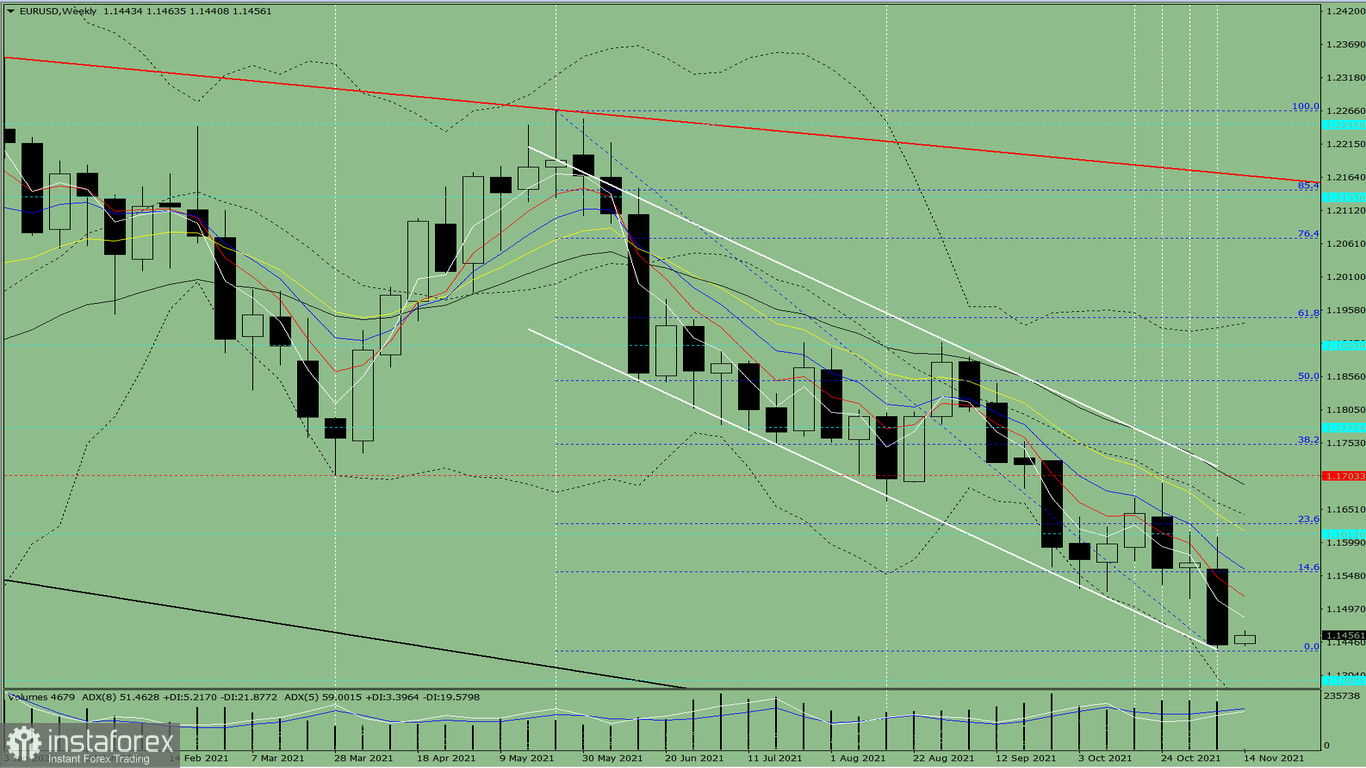
Figure 1 (weekly chart)
Comprehensive analysis:
An upward movement can be concluded based on a comprehensive analysis.
The overall result of the candlestick calculation based on the weekly chart: the price will most likely move in an upward trend without a lower shadow (Monday - up) and with an upper shadow (Friday - down) in the weekly white candlestick.
This week, the price from the level of 1.1442 (closing of the last weekly candle) may start its growth to the target of 1.1554 – the pullback level of 14.6% (blue dotted line). In the event that this level is broken upward, the upward movement may resume to the target of 1.1628 – the pullback level of 23.6% (blue dotted line).
Alternatively, the price from the level of 1.1442 (closing of the last weekly candle) may continue to decline to test the historical support level of 1.1387 (blue dotted line). After reaching this level, it may move up to the target of 1.1554 – the pullback level of 14.6% (blue dotted line).
InstaForex analytical reviews will make you fully aware of market trends! Being an InstaForex client, you are provided with a large number of free services for efficient trading.

