empty
 
 
Chystáte sa opustiť
www.instaforex.eu >
webovú stránku, ktorú prevádzkuje
INSTANT TRADING EU LTD
Otvoriť účet

30.11.202110:55 Forex Analysis & Reviews: Trading plan for starters of EUR/USD and GBP/USD on November 30, 2021

Tieto informácie poskytujeme retailovým a profesionálnym klientom ako súčasť marketingovej komunikácie. Neobsahujú investičné poradenstvo, investičné odporúčania, ponuku ani výzvu na vykonanie transakcie alebo použitie stratégie na finančných nástrojoch a ani by sa tak nemalo s nimi zaobchádzať. Minulá výkonnosť nie je zárukou ani predikciou budúceho výkonu. Spoločnosť Instant Trading EU Ltd. neručí a nepreberá žiadnu zodpovednosť za správnosť a úplnosť poskytovaných informácií ani za stratu, ktorá by vyplynula z akejkoľvek investície založenej na analýze, predpovedi alebo iných informáciách poskytnutých zamestnancom spoločnosti alebo iným spôsobom. Celé vylúčenie zodpovednosti nájdete tu.
Here are the details of the economic calendar for November 29, 2021:
Yesterday, UK's lending market data were published, which turned out to be worse than forecasts. The only positive factor was the volume of consumer lending, which rose by 0.7 billion pounds. The number of mortgage loans approved in the period of October is only 62.2 thousand against 72.6 thousand in the previous month. At the same time, the volume of mortgage lending amounted to only 1.6 billion pounds, although it was 9.28 billion pounds a month ago. In general, the data is bad.
As a result, the pound sterling declined for some time after the publication.

Analysis of trading charts from November 29:

The EUR/USD pair follows a corrective pattern from the 1.1160/1.1180 support area, where a variable resistance level in the face of 1.1330 stands in the way of speculators. Taking into account the scale of the weakening of the euro in November, buyers still have chances to prolong the correction.
The GBP/USD pair updated this year's local low last week, but no drastic changes have yet been made. Instead, the quote has formed a sideways channel in the range of 1.3290/1.3350, which keeps traders for more than 40 hours.

Exchange Rates 30.11.2021 analysis

November 30 economic calendar:

Today, all traders' attention will be focused on preliminary data on Eurozone's inflation. Based on forecasts, the indicators are disappointing. Inflation should accelerate from 4.1% to 4.5%. The situation is aggravated by the ECB's inaction, which scares investors in this situation. Thus, speculative activity is not excluded during the publication of data and after.

10:00 Universal time - Europe inflation

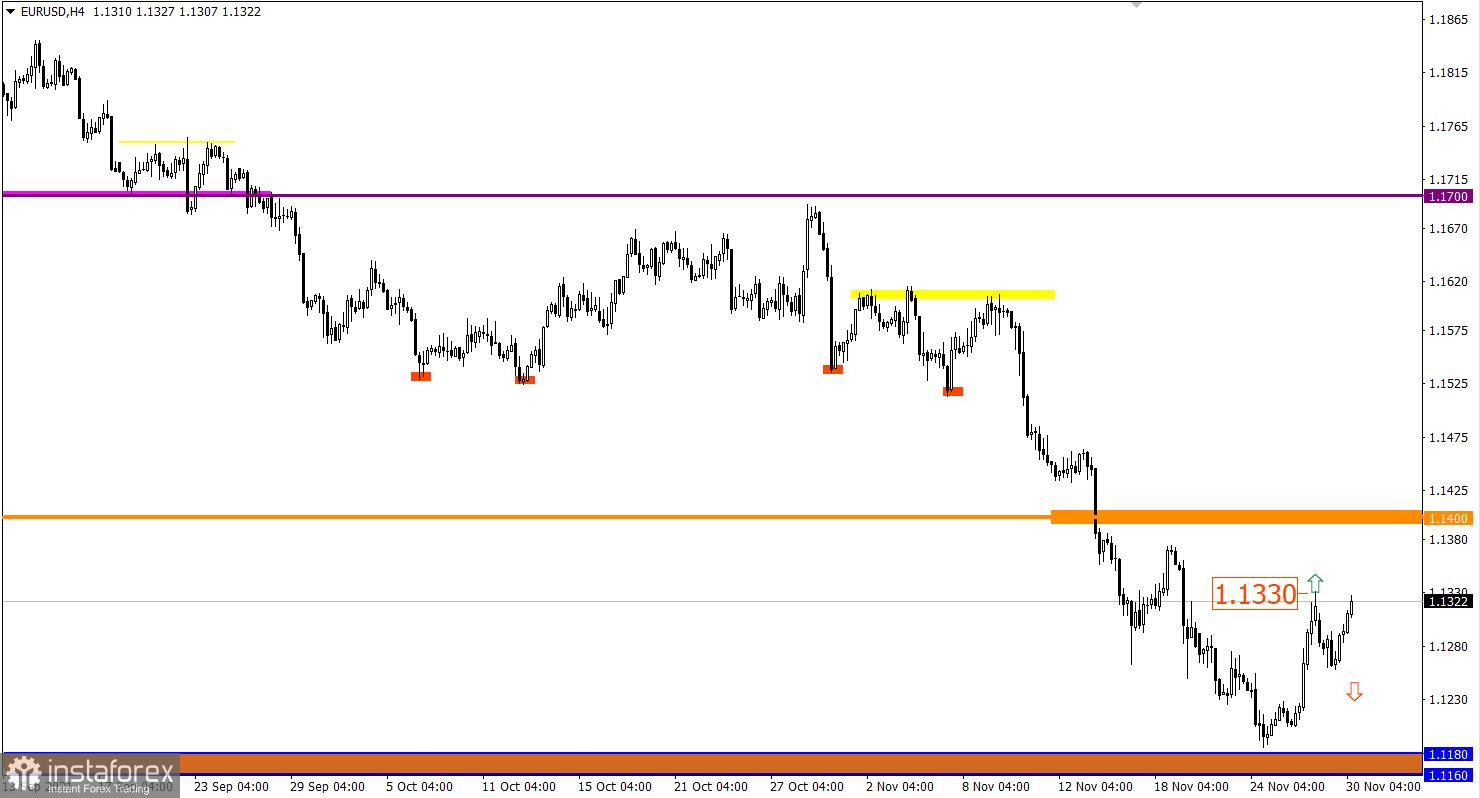
Trading plan for EUR/USD on November 30:

It is quite possible that the correction will end soon, but the maximum level for buyers is considered to be 1.1400. In this case, holding the price above the level of 1.1330 in a four-hour period will lead to a movement towards 1.1400.

The main pivot point is the price area 1.1160/1.1180. Repeated convergence of the price may increase the chance of its breakdown.

Exchange Rates 30.11.2021 analysis

Trading plan for GBP/USD on November 30:

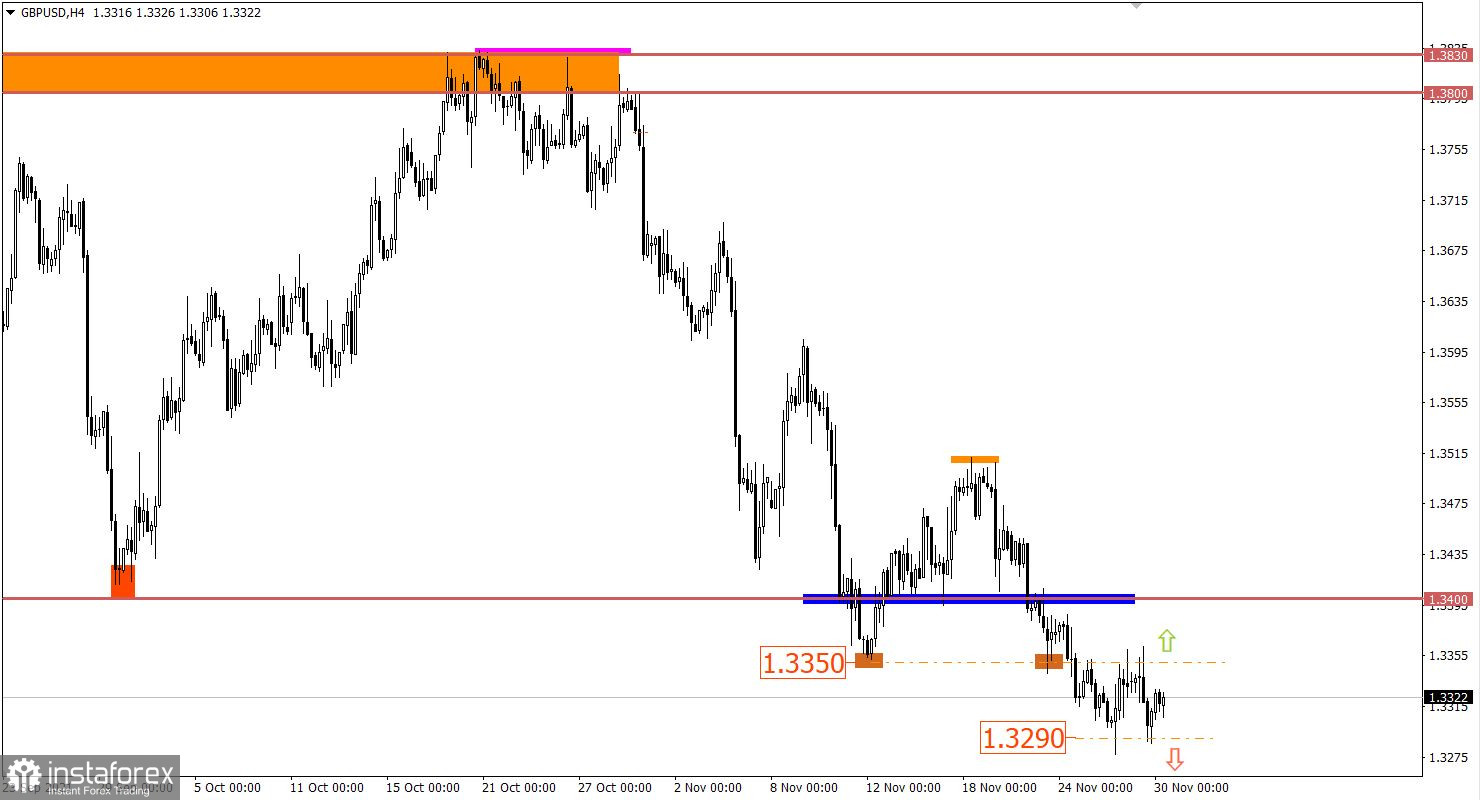
The side channel in the range of 1.3290/1.3350 will be completed soon. It can be assumed that there is a process of accumulation of trading forces. As a result, this will lead to a natural acceleration in the market.

In this situation, the most appropriate trading tactic is considered to be the method of breaking one or another border of the established range.

Trading recommendations

Buy positions should be considered after holding the price above the level of 1.3360 in a four-hour period.

Sell positions should be considered after holding the price below the level of 1.3290 in a four-hour period.

Exchange Rates 30.11.2021 analysis

What is reflected in the trading charts?

A candlestick chart view is graphical rectangles of white and black light, with sticks on top and bottom. When analyzing each candle in detail, you will see its characteristics of a relative period: the opening price, closing price, and maximum and minimum prices.

Horizontal levels are price coordinates, relative to which a stop or a price reversal may occur. These levels are called support and resistance in the market.

Circles and rectangles are highlighted examples where the price of the story unfolded. This color selection indicates horizontal lines that may put pressure on the quote in the future.

The up/down arrows are the reference points of the possible price direction in the future.

Gven Podolsky
Analytical expert of InstaForex
© 2007-2024

Open trading account

InstaForex analytical reviews will make you fully aware of market trends! Being an InstaForex client, you are provided with a large number of free services for efficient trading.


Teraz opúšťate stránku www.instaforex.eu, ktorá patrí spoločnosti INSTANT TRADING EU LTD
Can't speak right now?
Ask your question in the chat.

Turn "Do Not Track" off