 Zostať
Podmienky obchodovania
Nástroje


Analyzing trades on Monday
EUR/USD on 30M chart
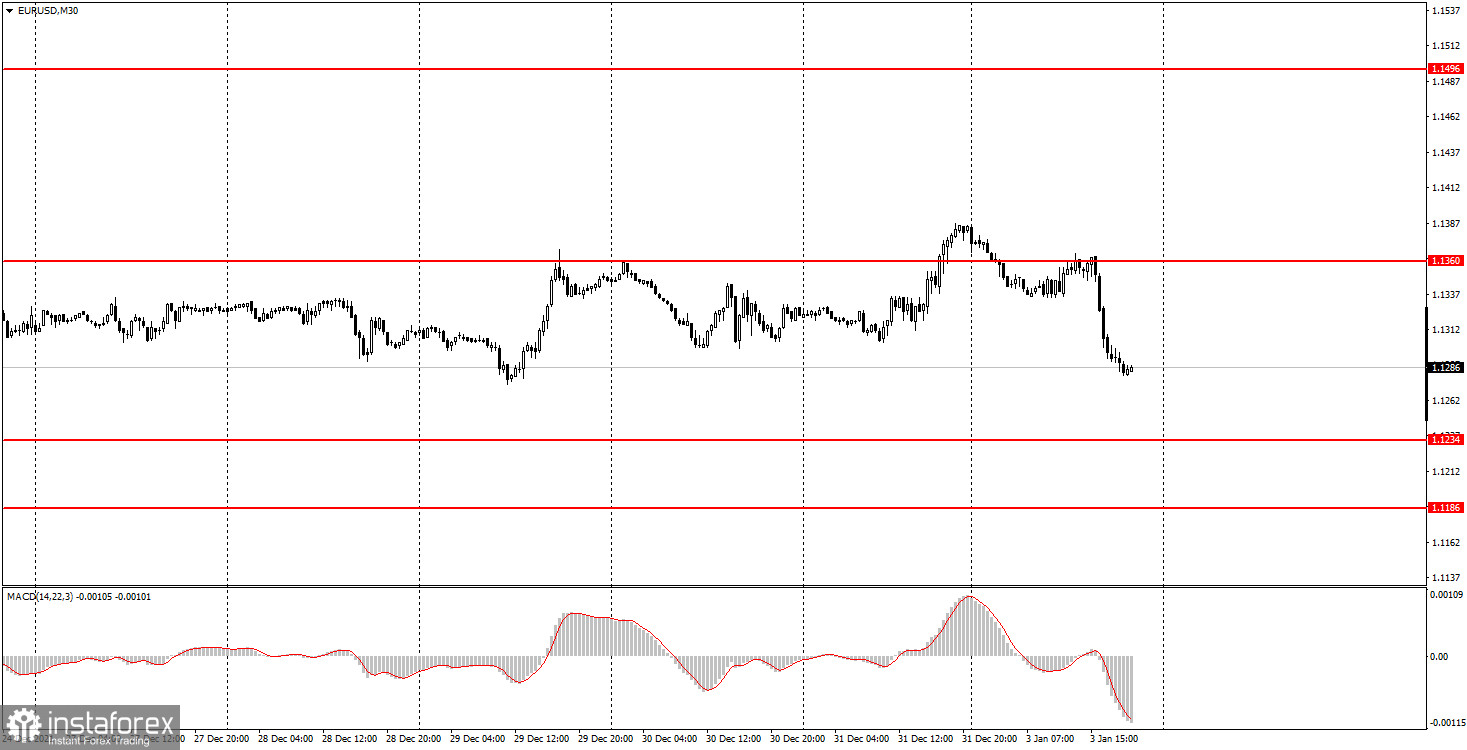
Trading activity on EUR/USD was very high on Monday. Given that the holidays had just ended, the foreign exchange market started the year right off the bat. The volatility on the first trading day was more than 100 points. Thus, despite the complete absence of any macroeconomic news and fundamental events, the market displayed high activity. In fact, two reports on PMI were released on Monday in the US and the EU but they had no effect on the pair's trajectory. There is no clear trend now on the 30-minute time frame. For a long time, the pair had been trading between the levels of 1.1234 and 1.1355. At the very end of 2021, the price consolidated above this range. However, already on Monday, the quotes dropped sharply, and the pair returned to the sideways channel. It is hard to say for sure whether the flat movement, where the pair has been stuck for more than a month, is completed. At the moment, the pair is still trading in the same sideways channel.
EUR/USD on 5M chart
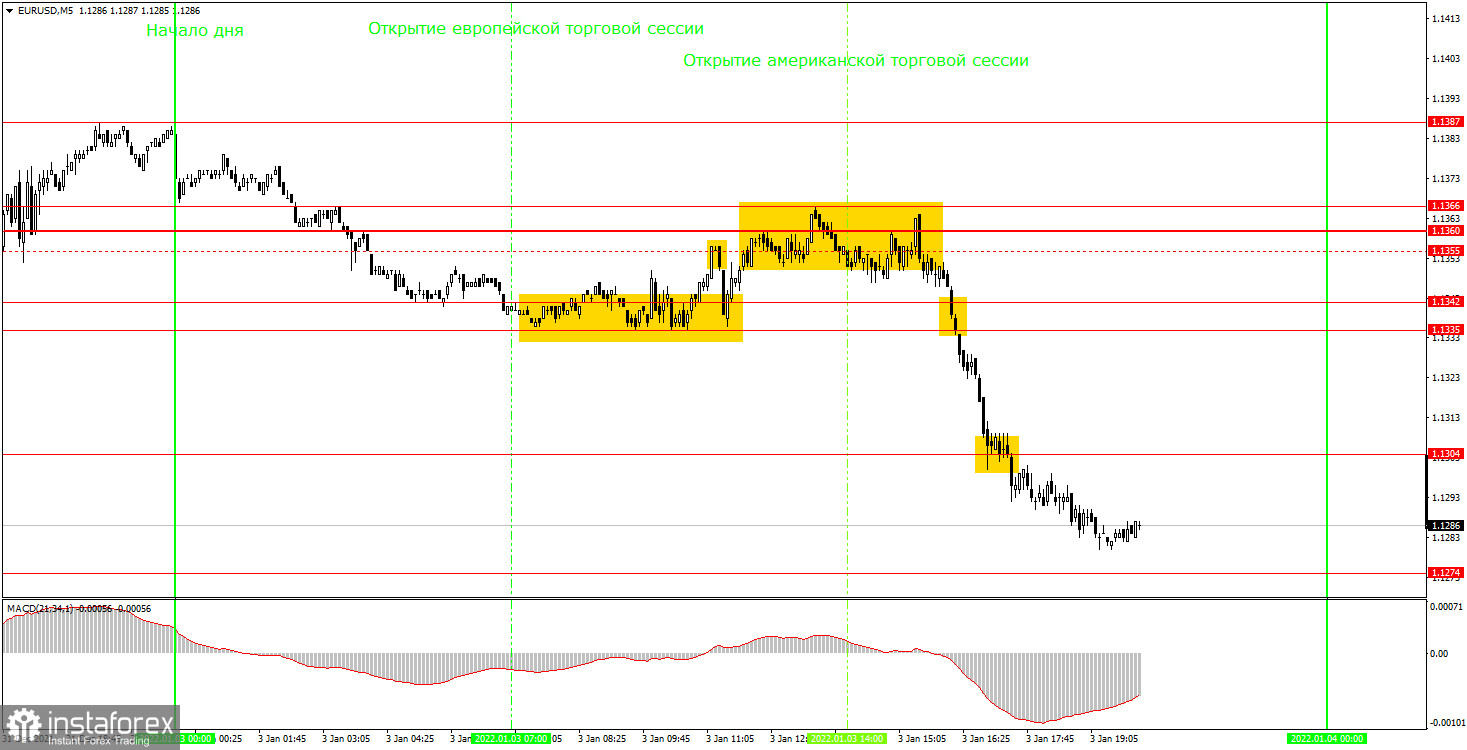
On the 5-minute time frame, the movement was very complicated on Monday. There were two important areas to highlight: 1.1335-1.1342 and 1.1355-1.1366. The distance between these areas was only 13 pips. Therefore, traders should have carefully followed the signals around these levels. To put it simply, all signals that were formed between the levels of 1.1335 and 1.1366 should have been considered very carefully. The nearest levels were too close to each other, and the probability of a rebound and a price reversal in the opposite direction was very high. Thus, novice traders should have used a breakout of the support area at 1.1335-1.1342 as the first signal. This is when short positions should have been opened with the targets at 1.1304 and 1.1274. Later in the day, the pair reached the first target and missed just a few points to reach the second one. Thus, a sell position could be closed manually with a profit of about 40 pips and at any Take Profit.
Trading tips for Tuesday
On the 30-minute time frame, the flat movement still prevails although the pair had every chance of completing it. However, the pair is trading between the levels of 1.1234 and 1.1360, so there is still no trend now. Besides, clear signals are not always formed near the boundaries of this channel. Therefore, it is extremely difficult to trade on the current time frame right now. There are more levels on the 5-minute chart, and many of them are located close to each other, so they should be considered as areas of support or resistance. On Tuesday, we recommend trading near the levels of 1.1227-1.1234, 1.1262-1.1274, 1.1304, and 1.1335-1.1342. We remind you that it is necessary to set a Take Profit at 30-40 pips and a Stop Loss to a breakeven point as soon as the price passes 15 points in the right direction. Trades can also be closed manually near important levels or after the formation of an opposite signal. As for fundamental events and macroeconomic statistics, only the ISM business activity index in the US manufacturing sector is due to be out on Tuesday.
On the chart
Support and Resistance Levels are the levels that serve as targets when buying or selling the pair. You can place Take Profit near these levels.
Red lines are channels or trend lines that display the current trend and show in which direction it is better to trade now.
The MACD indicator (14, 22, and 3) consists of a histogram and a signal line. When they cross, this is a signal to enter the market. It is recommended to use this indicator in combination with trend patterns (channels and trend lines).
Important announcements and economic reports that you can always find on the economic calendar can seriously influence the trajectory of a currency pair. Therefore, at the time of their release, we recommend trading as carefully as possible or exiting the market in order to avoid sharp price fluctuations.
Beginners on Forex should remember that not every single trade has to be profitable. The development of a clear strategy and money management is the key to success in trading over a long period of time.
InstaForex analytical reviews will make you fully aware of market trends! Being an InstaForex client, you are provided with a large number of free services for efficient trading.


