 Zostať
Podmienky obchodovania
Nástroje

The Australian dollar is tangled in technical resistances on the daily scale chart. These are the MACD indicator line and the 0.6950 price level, which is currently playing the role of support. The technical pattern we identified at the beginning of June (1) is exactly the same in the last days (2).
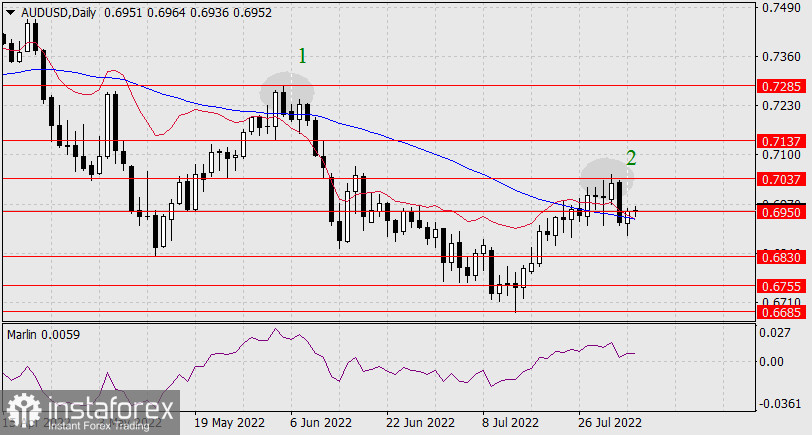
This pattern looks like a price consolidating above the MACD line with the development of price resistance, a retest of the MACD line and a sharp start to the medium-term fall. The target levels of the expected decline are: 0.6830, 0.6755, 0.6685, 0.6640.
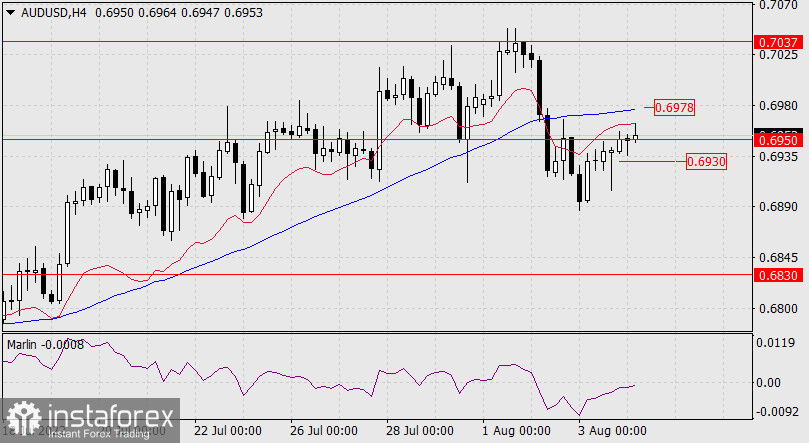
The situation is completely downward on a four-hour scale: the price is below both indicator lines, the Marlin Oscillator has not yet left the zone of negative values. The exit above the MACD line, above the level of 0.6978, may delay the development of the downward trend. Consolidating below 0.6930 (this is the daily MACD line) opens the way to the first target level of 0.6830.
InstaForex analytical reviews will make you fully aware of market trends! Being an InstaForex client, you are provided with a large number of free services for efficient trading.


