 Zostať
Podmienky obchodovania
Nástroje


Details of the economic calendar for August 18
The annual inflation rate in the euro area accelerated to 8.9% in July from 8.6% a month earlier, eventually updating the historical record. The market ignored the data since it completely coincided with the preliminary estimate. Nevertheless, rising inflation in the EU points to further steps by the ECB to raise interest rates.
During the American trading session, weekly data on jobless claims in the United States were published, where, despite the divergence of forecasts, we still saw an increase in their volume.
Statistics details:
Continuing claims for benefits increased from 1.430 million to 1.437 million.
Initial claims for benefits decreased from 252,000 to 250,000.
Analysis of trading charts from August 18
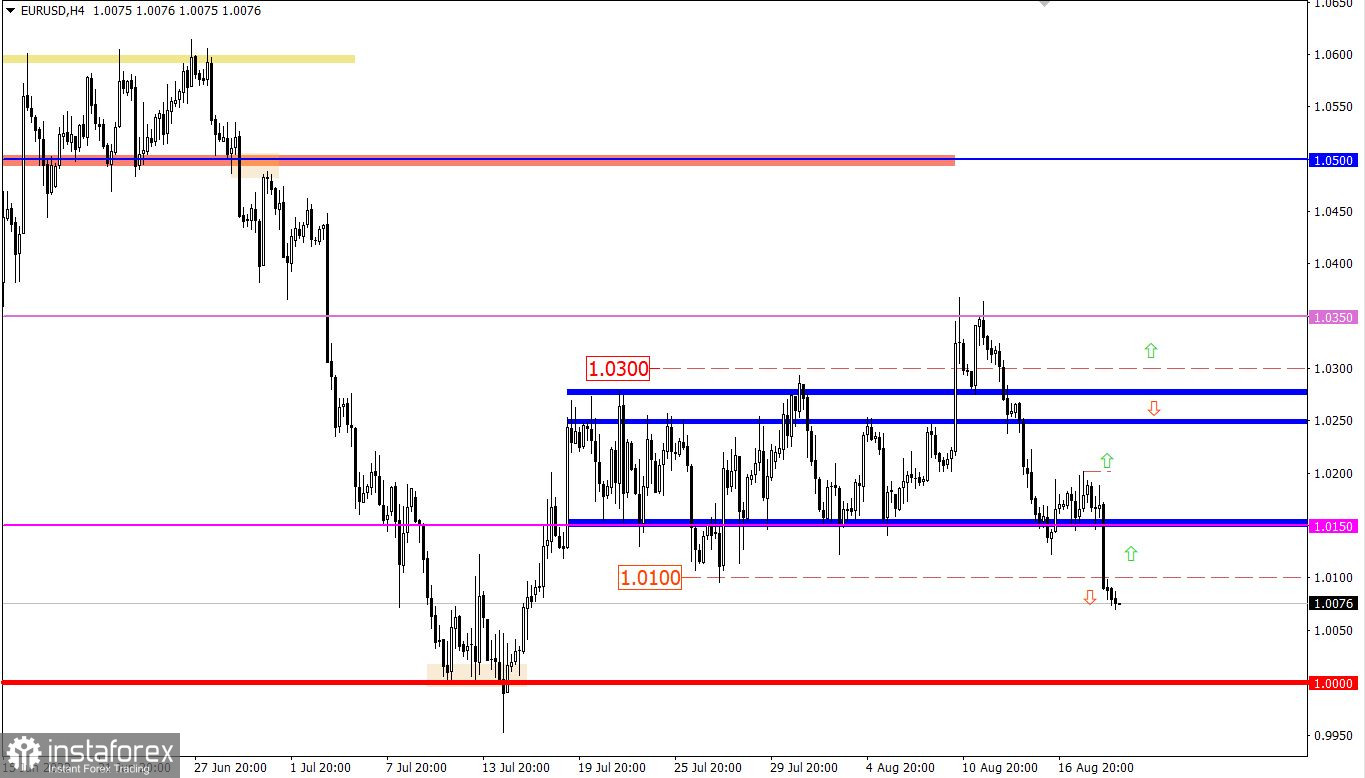
The EURUSD currency pair, after a short stagnation within the 1.0150 level, managed to regroup trading forces. As a result, traders managed to properly increase the volume of dollar positions. This step led to a breakdown of the reference value of 1.0100.
On the trading chart of the daily period, there is an attempt to prolong the medium-term downward trend. The recovery of the dollar relative to the recent correction is 72%.
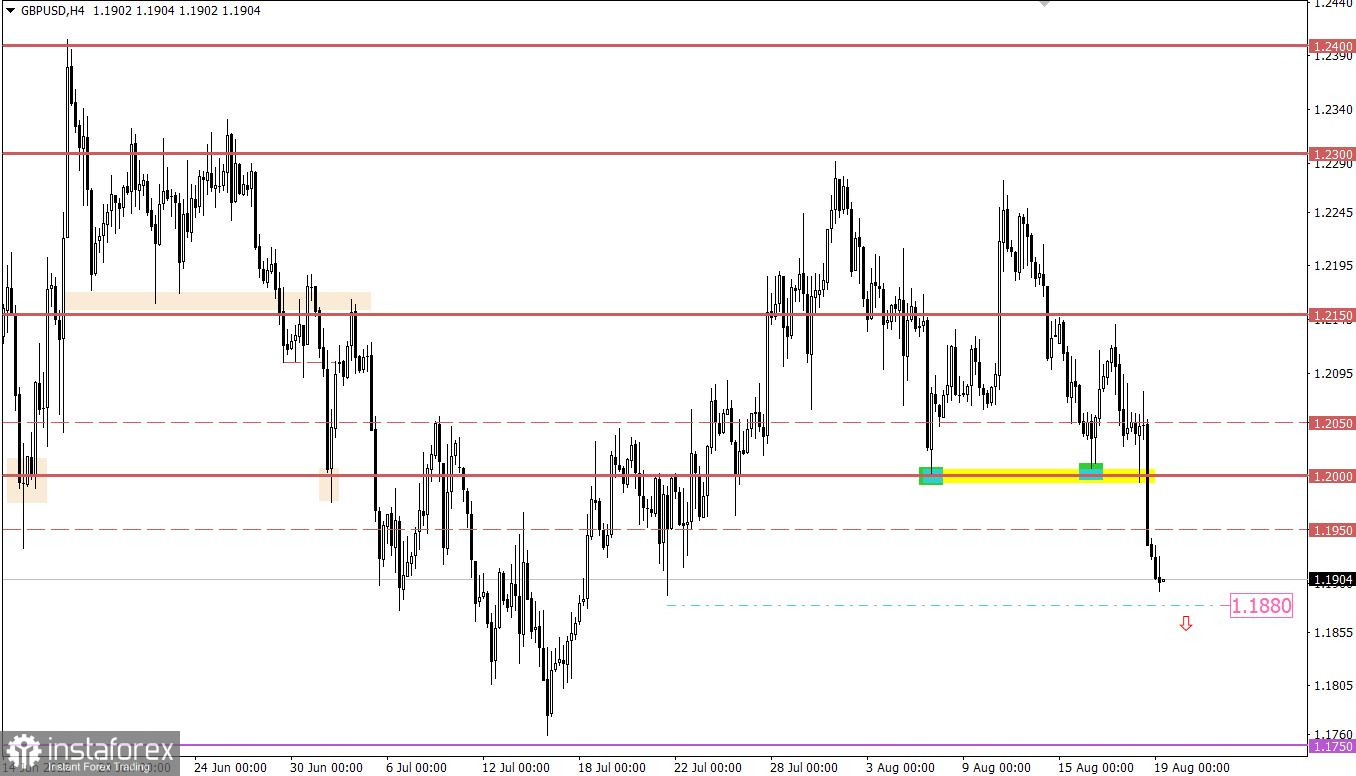
The GBPUSD currency pair noticeably accelerated the decline, which led to the breakdown of the psychological level of 1.2000. Typical speculative interest has accelerated the sale of the pound by more than 140 points, placing the quote below 1.1900.
On the trading chart of the daily period, there is also an attempt to resume the medium-term downward trend. The recovery of dollar positions relative to the recent correction is 72%.
Thus, based on the daily charts, it can be seen that EURUSD and GBPUSD are moving after, actively restoring the downward trend.

Economic calendar for August 19
At the opening of the European session, UK retail sales data were published, its rate of decline slowed down from -6.2% to -3.0%. And let's talk about the decline in sales. The very fact of slowing down this process is important.
Important statistics in Europe and the US are not expected.
Trading plan for EUR/USD on August 19
Despite the local signal of oversold euro in the short term, the market remains in a downward interest. Thus, the subsequent price retention below the 1.0100 mark may push the quote towards parity.
Traders will consider an alternative scenario if the price returns above 1.0100 in a four-hour period.
Trading plan for GBP/USD on August 19
The current price change suggests a recovery of the downward trend relative to the recent correction. Keeping the price below the 1.1880 mark may well prolong the set inertial move in the direction of the local low of the medium-term trend at 1.1750.
It is worth considering that the signal about the oversold of the pound sterling is already taking place in the short-term and intraday periods. Thus, a technical pullback in the market cannot be ruled out.
What is shown in the trading charts?
A candlestick chart view is graphical rectangles of white and black light, with sticks on top and bottom. When analyzing each candle in detail, you will see its characteristics of a relative period: the opening price, closing price, and maximum and minimum prices.
Horizontal levels are price coordinates, relative to which a stop or a price reversal may occur. These levels are called support and resistance in the market.
Circles and rectangles are highlighted examples where the price of the story unfolded. This color selection indicates horizontal lines that may put pressure on the quote in the future.
The up/down arrows are the reference points of the possible price direction in the future.
InstaForex analytical reviews will make you fully aware of market trends! Being an InstaForex client, you are provided with a large number of free services for efficient trading.


