 Zostať
Podmienky obchodovania
Nástroje


Trend analysis (Fig. 1).
The euro-dollar pair may move downward from the level of 0.9688 (close of Friday's daily candle) to the target of 0.9503, the 208% Fibonacci retracement level (red dotted line). From this level, an upward movement is possible with the target of 0.9646, the 14.6% retracement level (white dotted line). After testing this level, the price may continue to move up to test 0.97401, the 23.6% retracement level (white dotted line).
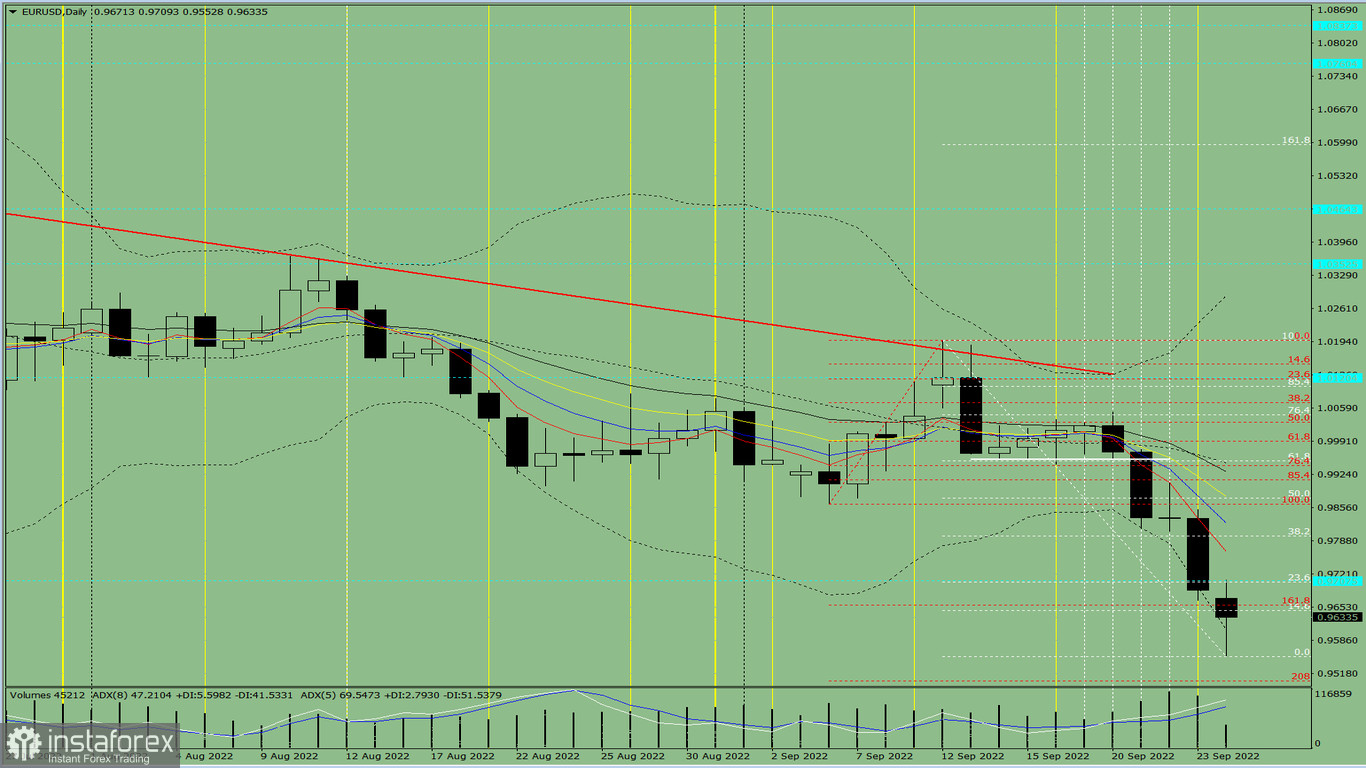
Fig. 1 (daily chart).
Comprehensive analysis:
General conclusion:
Today the price may move downward from the level of 0.9688 (close of Friday's daily candle) to the target of 0.9503, the 208% Fibonacci retracement level (red dotted line). From this level, an upward movement is possible with the target of 0.9646, the 14.6% retracement level (white dotted line). After testing this level, the price may continue to move up to test 0.97401, the 23.6% retracement level (white dotted line).
Alternative scenario: from the level of 0.9688 (close of Friday's daily candle), the price may move downward with the target of 0.9609, the lower limit of the Bollinger band indicator (black dotted line). After testing this level, the price may roll back up.
InstaForex analytical reviews will make you fully aware of market trends! Being an InstaForex client, you are provided with a large number of free services for efficient trading.


