 Zostať
Podmienky obchodovania
Nástroje


trend analysis
GBP/USD will move up in October, starting from the closing of the September monthly candle at 1.1165 to the historical resistance level at 1.1443 (blue dotted line). Upon reaching it, the quote will continue rising to the 38.2% retracement level at 1.1825 (red dotted line), then roll back downwards.
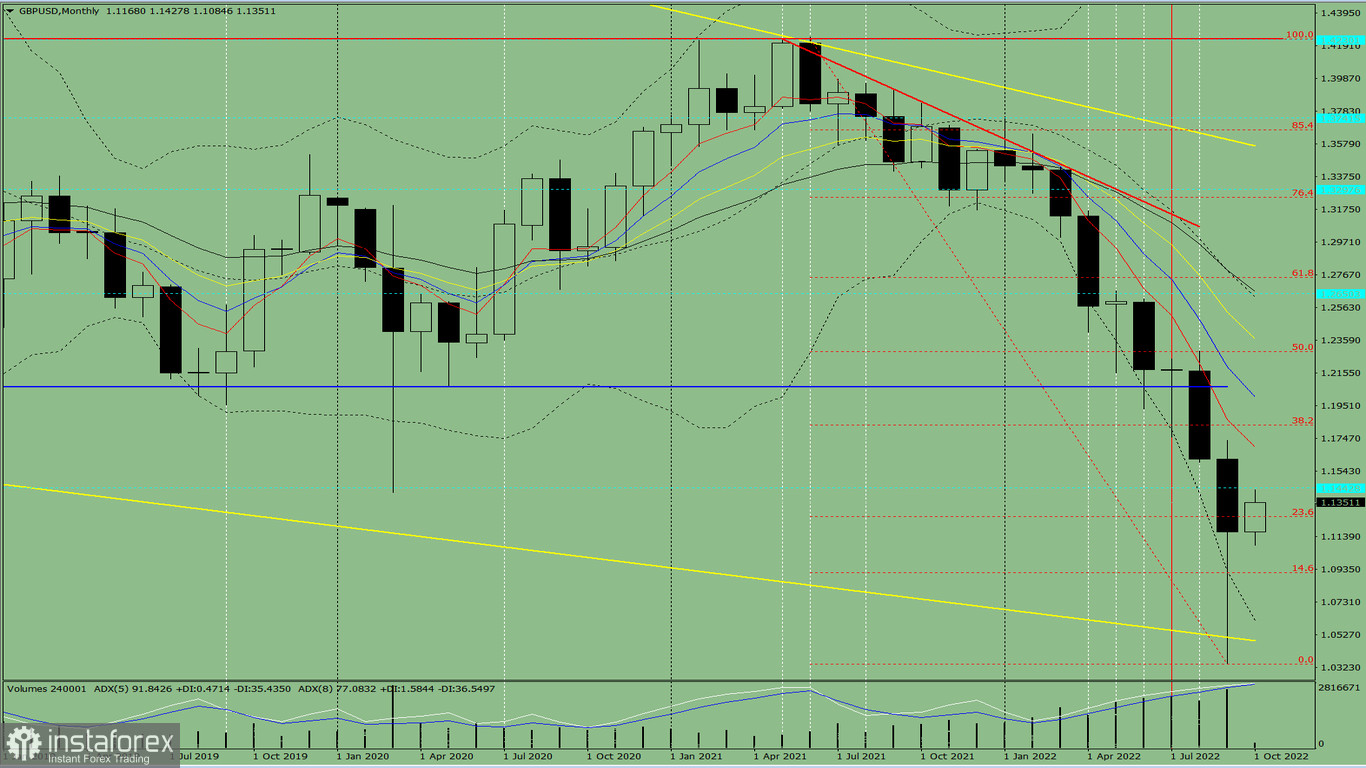
Fig. 1 (monthly chart)
Comprehensive analysis:
Indicator analysis - uptrend
Fibonacci levels - uptrend
Volumes - uptrend
Candlestick analysis - uptrend
Trend analysis - uptrend
Bollinger bands - uptrend
All this points to an upward movement in GBP/USD.
Conclusion: The pair will have a bullish trend with no first lower shadow on the monthly white candle (the first week of the month is white) and a second upper shadow (the last week is black).
Throughout the month, quotes will climb from 1.1165 (closing of the September monthly candle) to the historical resistance level at 1.1443 (blue dotted line), go to the 38.2% retracement level at 1.1825 (red dotted line), then turn downwards.
Alternatively, pound could rise from 1.1165 (closing of the September monthly candle) to the historical support level at 1.1443 (blue dotted line), then bounce down to the support line at 1.0505 (thick yellow line). Upward movement may resume from this level.
InstaForex analytical reviews will make you fully aware of market trends! Being an InstaForex client, you are provided with a large number of free services for efficient trading.

