 Zostať
Podmienky obchodovania
Nástroje


trend analysis
GBP/USD will move downward this week, most likely from the closing of the last weekly candle at 1.2288 to the support line at 1.2044 (blue bold line). But after that it will rise to the historical resistance level at 1.2499 (blue dotted line) and to higher price levels.
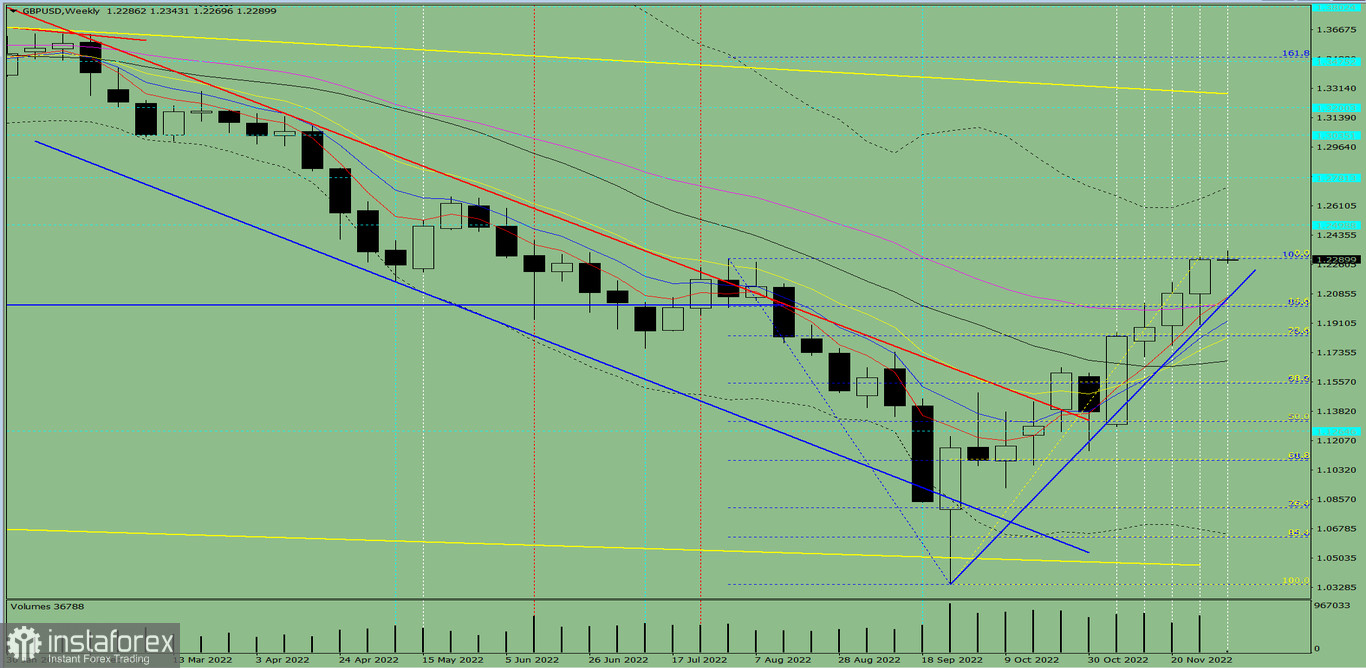
Fig. 1 (weekly chart)
Comprehensive analysis:
Indicator analysis - downtrend
Fibonacci levels - downtrend
Volumes - downtrend
Candlestick analysis - downtrend
Trend analysis - uptrend
Bollinger bands - uptrend
Monthly chart - uptrend
All this points to a downward movement in GBP/USD.
Conclusion: The pair will have a bearish trend, with no first upper shadow on the weekly black candle (Monday - down) and a second lower shadow (Friday - up).
So during the week, pound will fall from 1.2288 (the closing of the last weekly candle) to the support line at 1.2044 (blue bold line), then bounce up to the historical resistance level at 1.2499 (blue dotted line). The upward movement may continue from this level.
Alternatively, quotes could go up from 1.2288 (the closing of the last weekly candle) to the historical resistance level at 1.2499 (blue dotted line). If this level is tested, the upward price movement may continue.
InstaForex analytical reviews will make you fully aware of market trends! Being an InstaForex client, you are provided with a large number of free services for efficient trading.


