 Zostať
Podmienky obchodovania
Nástroje


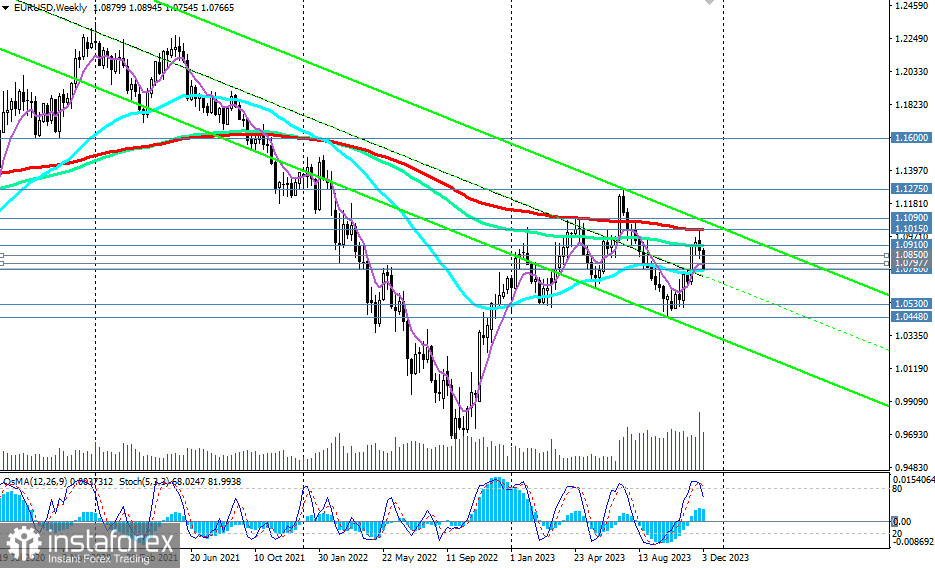
Since the end of last month, EUR/USD has been actively declining. After reaching a high on November 29 at 1.1016, the pair sharply decreased, coming under pressure after the publication of inflation data in the Eurozone: the annual consumer price index growth rate fell to +2.4% (from +2.9% earlier, with a forecast of +2.7%), marking the slowest growth rate since July 2021.
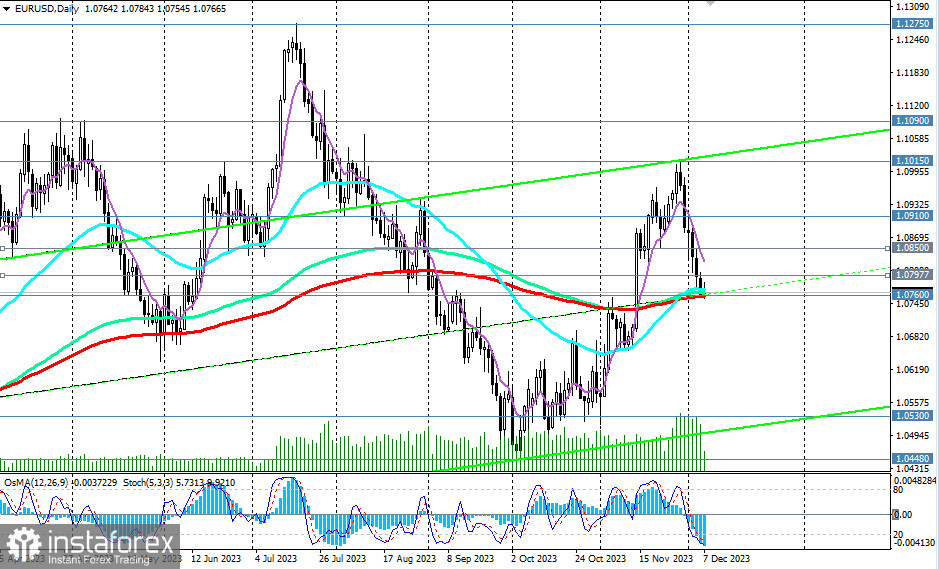
As of writing, EUR/USD was trading near the 1.0765 mark, attempting to break into the bearish medium-term market zone and testing the key support level at 1.0760 (200 EMA on the daily chart, 50 EMA on the weekly chart). Its breakdown and further decline will confirm a return to the long-term downward trend in which the pair has been since June 2021.
In case this scenario is realized, the nearest downside targets will be the local support levels of 1.0530, 1.0450, and then the marks of 1.0400, 1.0300, near which the lower boundary of the downward channel on the weekly chart passes.
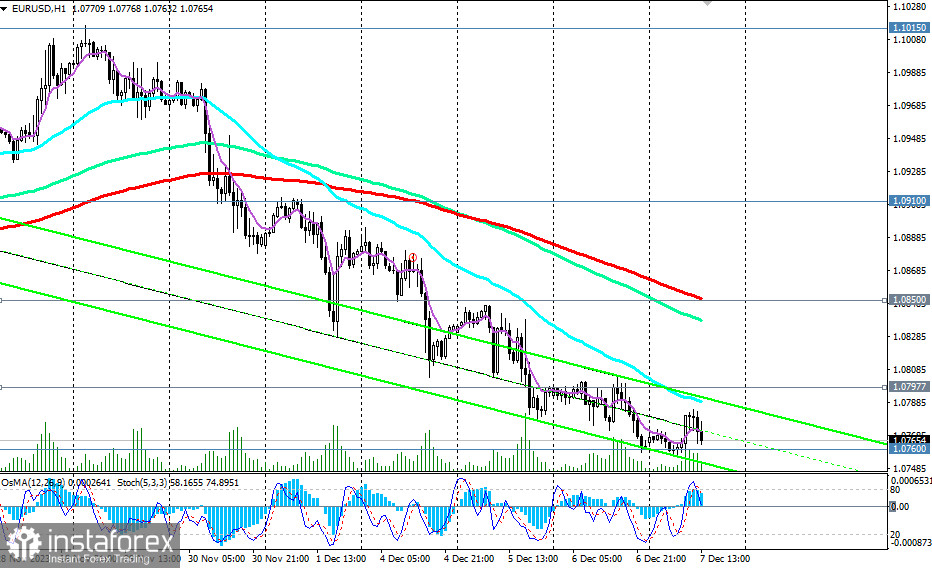
In an alternative scenario, EUR/USD will resume its rise. The first signal for new long positions is the breakout of the 1.0798 resistance level (200 EMA on the 4-hour chart) and the local resistance level 1.0800. The growth target is the 1.0910 resistance level (144 EMA on the weekly chart). However, only the breakout of the key resistance level at 1.1015 (200 EMA on the weekly chart) and the local resistance level at 1.1090 will lead EUR/USD into the zone of the long-term bullish market.
Below the support level of 1.0760, short positions are preferable.
Support levels: 1.0760, 1.0700, 1.0600, 1.0530, 1.0500, 1.0450, 1.0400, 1.0300
Resistance levels: 1.0798, 1.0800, 1.0850, 1.0900, 1.0910, 1.1000, 1.1015, 1.1090, 1.1100, 1.1200, 1.1275, 1.1300, 1.1400, 1.1500, 1.1600
Trading Scenarios:
Main Scenario: Sell Stop 1.0745. Stop-Loss 1.0810. Targets 1.0700, 1.0600, 1.0530, 1.0500, 1.0450, 1.0400, 1.0300
Alternative Scenario: Buy Stop 1.0810. Stop-Loss 1.0745. Targets 1.0850, 1.0900, 1.0910, 1.1000, 1.1015, 1.1090, 1.1100, 1.1200, 1.1275, 1.1300, 1.1400, 1.1500, 1.1600
"Targets" correspond to support/resistance levels. This also does not mean that they will necessarily be reached, but can serve as a guide when planning and placing your trading positions.
InstaForex analytical reviews will make you fully aware of market trends! Being an InstaForex client, you are provided with a large number of free services for efficient trading.


