 Zostať
Podmienky obchodovania
Nástroje


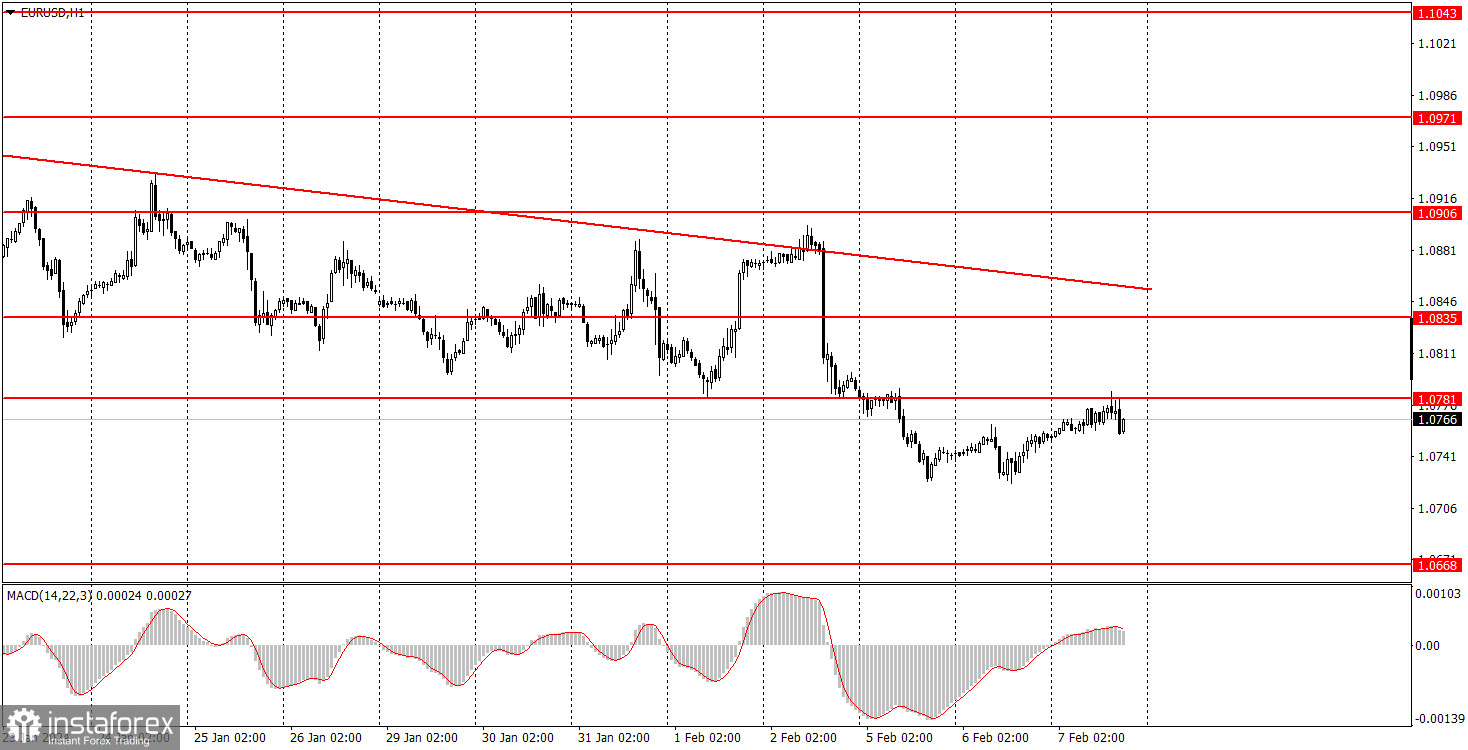
EUR/USD continued to gradually correct higher on Wednesday and ended the day near the level of 1.0781. A bounce from this level could bring back the downward movement for purely technical reasons. The downtrend persists, as shown by the descending trendline. Thus, both experienced and novice traders can expect the euro to fall further.
On Wednesday, macroeconomic and fundamental backgrounds were practically absent. In the morning, Germany released a report on industrial production, which, predictably, turned out to be below forecasts. This means that the euro had much more grounds to fall than rise. However, the decline may start from the level of 1.0781, as the global fundamental backdrop continues to support the US dollar, which we have been talking about for several months. Therefore, we expect the pair to fall further.
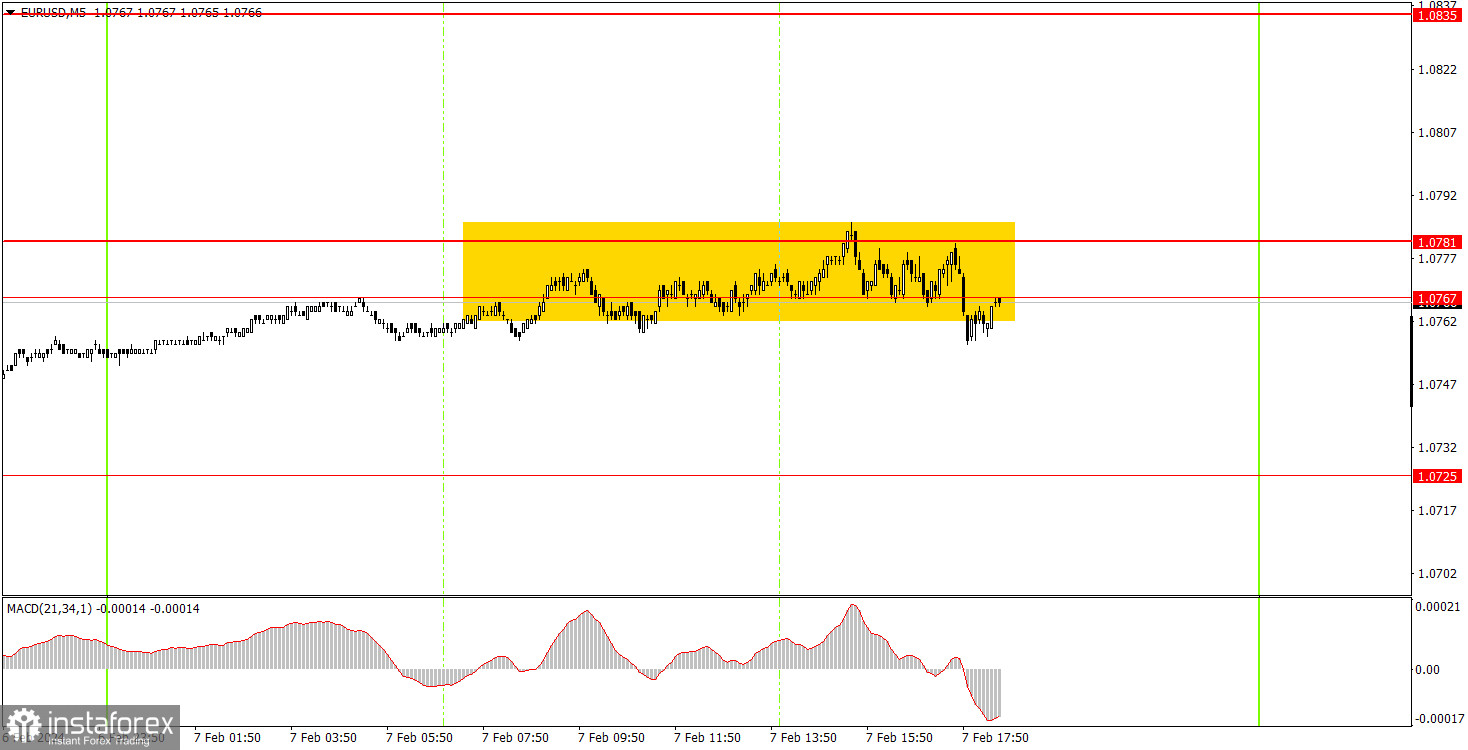
There were no trading signals generated on the 5-minute timeframe. Early in the morning, the price entered the range of 1.0767-1.0781 and traded within this range throughout the day. Therefore, we can only observe three things: it was a total flat, there was no volatility, and there were no trading signals. It is possible that a buy or sell signal could form, and traders could even execute the signal since the price is near an important level. However, it is important to remember that movements at night can be unpredictable, and it is more challenging to track market changes at this time than during the day.
On the hourly chart, EUR/USD exhibited a downward movement, as the results of the FOMC meeting were hawkish, and the labor market and unemployment data were very strong. We considered the possibility that the downtrend could end if we received disappointing news, but that did not happen. For now, everything is going as we assumed. The euro is still too overbought and unreasonably expensive.
The key levels on the 5M chart are 1.0568, 1.0611-1.0618, 1.0668, 1.0725, 1.0767-1.0781, 1.0835, 1.0896-1.0904, 1.0940, 1.0971-1.0981, 1.1011, 1.1043, 1.1091. Thursday's macroeconomic backdrop will be no better than Wednesday's. The only report of the day is the US unemployment claims. This report is of secondary importance, so we don't expect a strong market reaction.
1) Signal strength is determined by the time taken for its formation (either a bounce or level breach). A shorter formation time indicates a stronger signal.
2) If two or more trades around a certain level are initiated based on false signals, subsequent signals from that level should be disregarded.
3) In a flat market, any currency pair can produce multiple false signals or none at all. In any case, the flat trend is not the best condition for trading.
4) Trading activities are confined between the onset of the European session and mid-way through the U.S. session, after which all open trades should be manually closed.
5) On the 30-minute timeframe, trades based on MACD signals are only advisable amidst substantial volatility and an established trend, confirmed either by a trendline or trend channel.
6) If two levels lie closely together (ranging from 5 to 15 pips apart), they should be considered as a support or resistance zone.
Support and Resistance price levels can serve as targets when buying or selling. You can place Take Profit levels near them.
Red lines represent channels or trend lines, depicting the current market trend and indicating the preferable trading direction.
The MACD(14,22,3) indicator, encompassing both the histogram and signal line, acts as an auxiliary tool and can also be used as a signal source.
Significant speeches and reports (always noted in the news calendar) can profoundly influence the price dynamics. Hence, trading during their release calls for heightened caution. It may be reasonable to exit the market to prevent abrupt price reversals against the prevailing trend.
Beginning traders should always remember that not every trade will yield profit. Establishing a clear strategy coupled with sound money management is the cornerstone of sustained trading success.
InstaForex analytical reviews will make you fully aware of market trends! Being an InstaForex client, you are provided with a large number of free services for efficient trading.


