 Zostať
Podmienky obchodovania
Nástroje


EUR/USD saw another round of "wonderful" movements. The day's volatility amounted to just over 50 pips, and the pair changed direction three times throughout the day. Take note that these reversals were not tied to any significant events or important levels. The pair was just randomly moving in different directions. Nevertheless, despite the low volatility and strange movements, the downtrend persists, with the euro smoothly sliding downwards. So, if one disregards the nature of the pair's movements on Thursday, everything is going according to plan. The descending trendline remains relevant, and fundamentally and macroeconomically, the backdrop mostly works in favor of the dollar.
By the way, yesterday's macro data supported the dollar. The German retail sales report fell short, while the US Q4 GDP report exceeded forecasts. Therefore, it was logical for the dollar to rise on Thursday. The only concern is that the pair retraces upward too frequently while it falls too slowly.
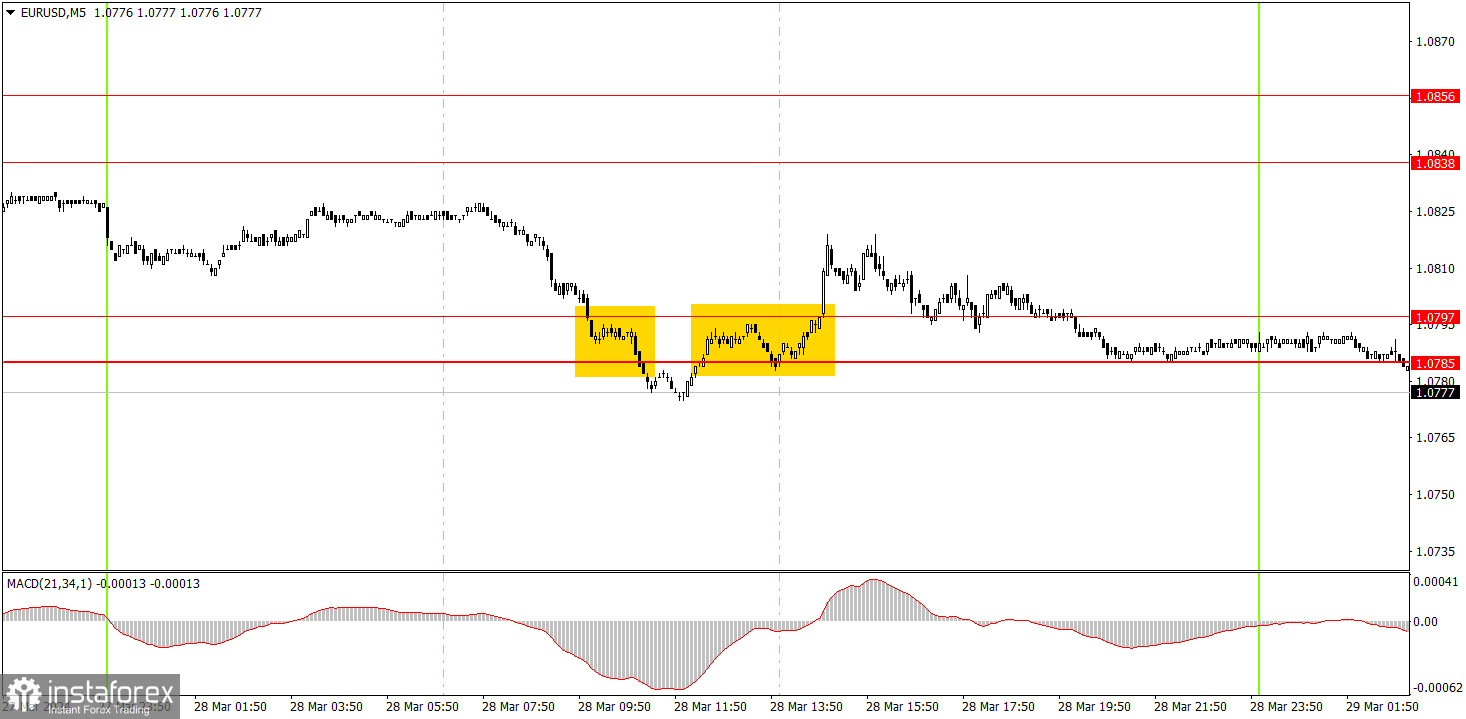
Several trading signals were generated on the 5-minute timeframe, but all of them left something to be desired. If the pair hadn't surprisingly increased at the end of the European and the beginning of the US session, everything would have been much better. However, because of this rise, a promising sell signal was canceled, and a false buy signal was formed around the 1.0785-1.0797 area. Neither of these signals resulted in profit, and the first one closed at a loss. Therefore, it's better to open positions on higher time frames now, where upward retracements are smoothed out.
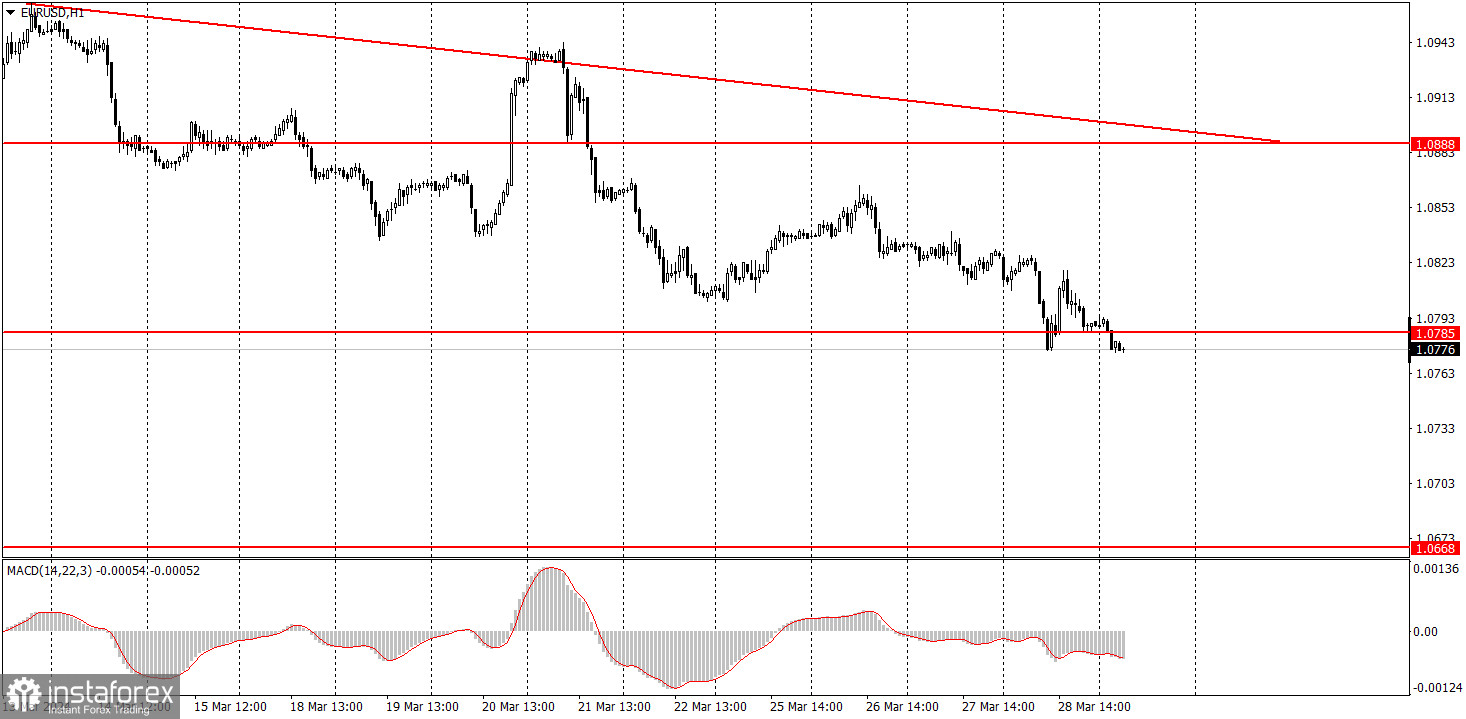
On the hourly chart, EUR/USD continues to move downward, which corresponds to the fundamental background. We believe that the euro should fall anyway, as the price is still too high, and the global trend is downward. Unfortunately, the market doesn't always want to trade the pair in a logical manner, and from time to time, we observe unreasonable growth. Moreover, the movements are quite weak.
Today, you can try trading bearish again, as the price has settled below the 1.0785-1.0797 area for the second time. We don't expect strong movements on Friday, which you should keep in mind when opening positions on the 5-minute timeframe.
The key levels on the 5M chart are 1.0568, 1.0611-1.0618, 1.0668, 1.0725, 1.0785-1.0797, 1.0838-1.0856, 1.0888-1.0896, 1.0940, 1.0971-1.0981, 1.1011, 1.1043, 1.1091. There are no significant events scheduled in the European Union on Friday. The US docket will feature the Personal Consumption Expenditures Price Index and changes in personal income and spending of American consumers. In the evening, Federal Reserve Chairman Jerome Powell will speak.
1) Signal strength is determined by the time taken for its formation (either a bounce or level breach). A shorter formation time indicates a stronger signal.
2) If two or more trades around a certain level are initiated based on false signals, subsequent signals from that level should be disregarded.
3) In a flat market, any currency pair can produce multiple false signals or none at all. In any case, the flat trend is not the best condition for trading.
4) Trading activities are confined between the onset of the European session and mid-way through the U.S. session, after which all open trades should be manually closed.
5) On the 30-minute timeframe, trades based on MACD signals are only advisable amidst substantial volatility and an established trend, confirmed either by a trendline or trend channel.
6) If two levels lie closely together (ranging from 5 to 15 pips apart), they should be considered as a support or resistance zone.
Support and Resistance price levels can serve as targets when buying or selling. You can place Take Profit levels near them.
Red lines represent channels or trend lines, depicting the current market trend and indicating the preferable trading direction.
The MACD(14,22,3) indicator, encompassing both the histogram and signal line, acts as an auxiliary tool and can also be used as a signal source.
Significant speeches and reports (always noted in the news calendar) can profoundly influence the price dynamics. Hence, trading during their release calls for heightened caution. It may be reasonable to exit the market to prevent abrupt price reversals against the prevailing trend.
Beginning traders should always remember that not every trade will yield profit. Establishing a clear strategy coupled with sound money management is the cornerstone of sustained trading success.
InstaForex analytical reviews will make you fully aware of market trends! Being an InstaForex client, you are provided with a large number of free services for efficient trading.

