 Zostať
Podmienky obchodovania
Nástroje


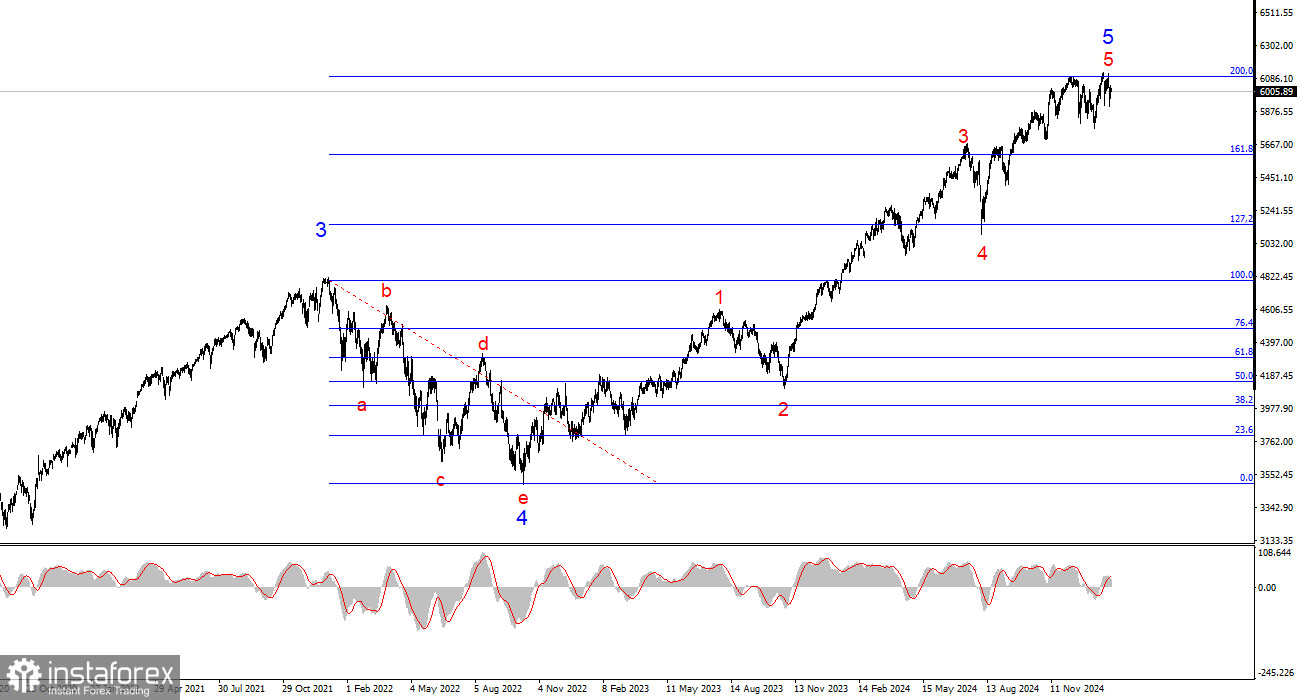
The wave pattern on the 4-hour chart for the #SPX instrument looks rather ambiguous. The first thing that stands out on the 24-hour chart is the global five-wave structure, which doesn't even fit into the terminal window at the smallest scale. In simple terms, U.S. stock indices have been rising for a very long time. And we know that trends change. Currently, wave 5 of 5 is still developing. The instrument has made three unsuccessful attempts to break through the 6093 mark, which corresponds to 200.0% Fibonacci from wave 4. In my view, we will likely see a new corrective wave or a series of waves soon. The U.S. stock market is overheated, and more and more experts are starting to talk about a "bubble."
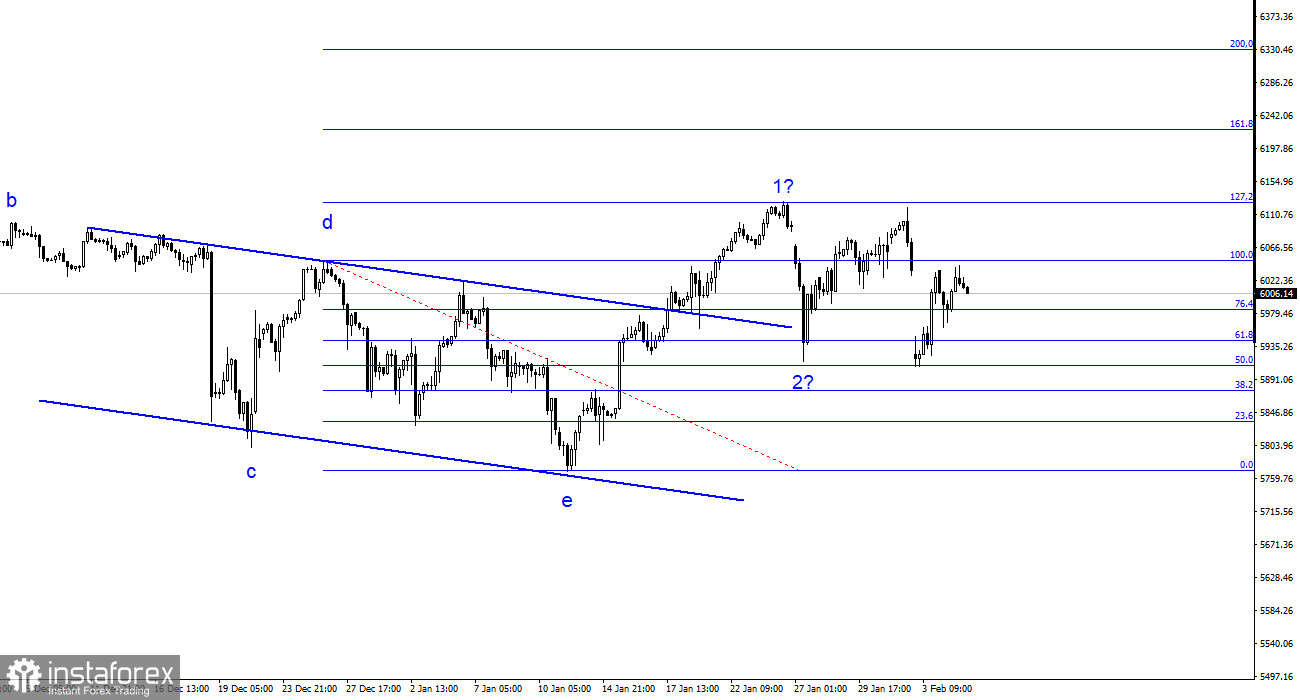
Switching to the 4-hour chart (as shown above), we see a completed complex a-b-c-d-e correction structure. I want to remind you that the wave structure should be clear and obvious, without ambiguity. The more complex the wave structure, the less likely it is to be profitable. The trend section after January 13 looked like the start of a new five-wave formation with waves 1 and 2 already built, but the Monday decline makes this structure unconvincing and ambiguous. Right now, I would rely on the daily chart wave pattern.
The #SPX instrument managed to recover most of its losses on Monday-Tuesday. This hasn't made the wave picture any clearer, and no one knows when Donald Trump might stir up the markets again. Therefore, I would say that most investors are currently focused not on making profits but on preserving their gains. Everyone understands that the "era of calm" is over. Now, America is ready to conflict with any country in the world, imposing its own terms on the global playing field. This is unlikely to be fertile ground for the growth of the U.S. stock market. Of course, some companies will show growth, but not all.
The first real trade war that might begin soon is between China and the U.S. Beijing is the only one that didn't yield to Trump and made it clear that every measure taken by Washington will be met with mirror sanctions. Beijing is not refusing negotiations but will impose retaliatory tariffs first and only then negotiate. A crucial aspect to understand here is the duration of the trade war. If, for example, Washington and Beijing reach an agreement by the end of the month and lift tariffs, will the one-month impact on the Chinese and U.S. economies be significant? In my opinion, no. But if they fail to agree, the trade war could drag on for years, causing real damage to both sides. For now, nothing catastrophic has happened.
Based on the #SPX analysis, I conclude that the instrument is in the final stages of the uptrend. I advise focusing on the 6093 mark and Trump's policies in the short term. Trump has started making decisions that threaten the stability of the U.S. economy and American companies (trade wars, tariffs, import duties), increasing the chances of seeing a new downtrend day by day. The "bubble" in the U.S. stock market continues to inflate. The 4-hour chart allows for three more waves up, but the 24-hour chart suggests the growth is ending. And I trust the daily chart more.
On a larger scale, the wave pattern is much clearer: a five-wave structure with another five-wave structure inside the fifth wave. This fifth wave may be nearing completion. Therefore, I would prepare for a long and complex correction, which may have already begun.
InstaForex analytical reviews will make you fully aware of market trends! Being an InstaForex client, you are provided with a large number of free services for efficient trading.


