Tieto informácie poskytujeme retailovým a profesionálnym klientom ako súčasť marketingovej komunikácie. Neobsahujú investičné poradenstvo, investičné odporúčania, ponuku ani výzvu na vykonanie transakcie alebo použitie stratégie na finančných nástrojoch a ani by sa tak nemalo s nimi zaobchádzať. Minulá výkonnosť nie je zárukou ani predikciou budúceho výkonu. Spoločnosť Instant Trading EU Ltd. neručí a nepreberá žiadnu zodpovednosť za správnosť a úplnosť poskytovaných informácií ani za stratu, ktorá by vyplynula z akejkoľvek investície založenej na analýze, predpovedi alebo iných informáciách poskytnutých zamestnancom spoločnosti alebo iným spôsobom. Celé vylúčenie zodpovednosti nájdete tu.
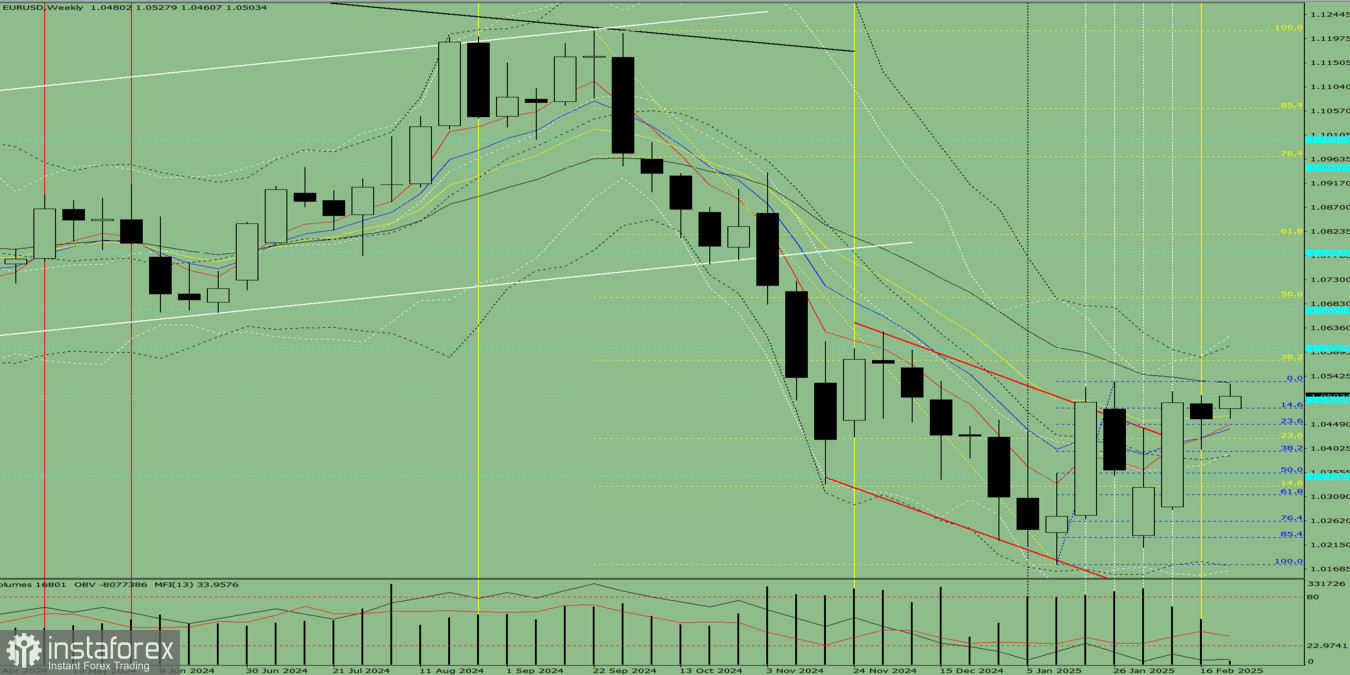
Trend Analysis (Fig. 1)This week, the market may rise from 1.0459 (last week's closing price) toward 1.0573, which represents the 38.2% retracement level (yellow dotted line). If this level is tested, the price could continue its upward movement toward 1.0597, a historical resistance level (blue dotted line).
Comprehensive Analysis
- Indicator Analysis: Bullish
- Fibonacci Levels: Bullish
- Volume Analysis: Bullish
- Candlestick Analysis: Bullish
- Trend Analysis: Bullish
- Bollinger Bands: Bullish
- Monthly Chart Outlook: Bullish
Conclusion: Uptrend Expected
Based on comprehensive analysis, the EUR/USD pair is expected to maintain an upward trajectory throughout the week. The projected weekly candle is likely to form without a lower shadow (indicating an upward Monday movement) but may develop an upper shadow by Friday, signaling a possible pullback.
Alternative Scenario
If the pair rises from 1.0459 to 1.0532 (upper fractal, blue dotted line), it may then reverse downward toward 1.0480, which corresponds to the 14.6% Fibonacci retracement level (blue dotted line).
InstaForex analytical reviews will make you fully aware of market trends! Being an InstaForex client, you are provided with a large number of free services for efficient trading.
 Zostať