 Zostať
Podmienky obchodovania
Nástroje


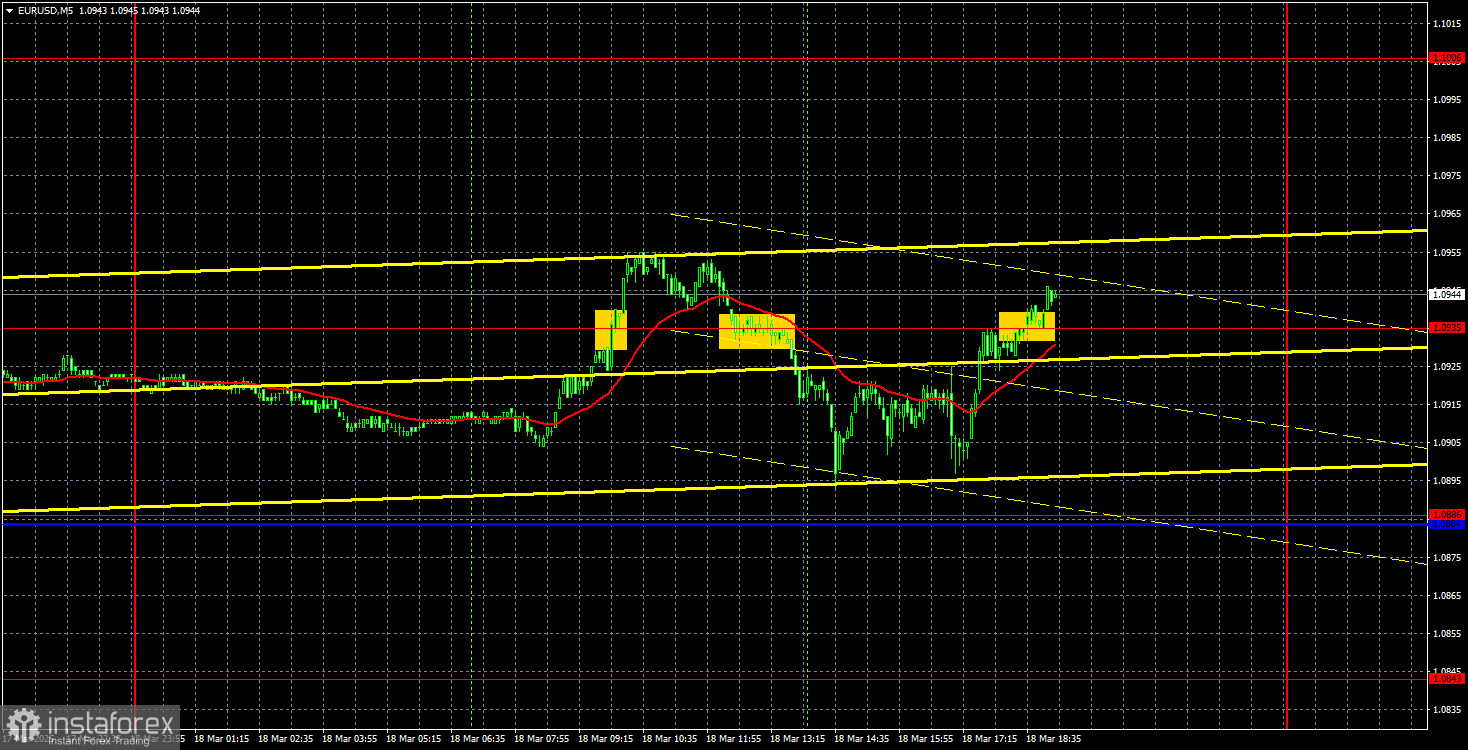
The EUR/USD currency pair continued to trade higher on Tuesday but remained within a limited range, which can be considered a sideways channel. There are currently two channels: sideways and a weak upward trend. The second one is marked in the illustration, while the first has boundaries at 1.0843 and 1.0949. Thus, a rebound from the 1.0949 level could trigger a slight decline in the pair. However, a significant drop remains unlikely. The most the dollar can show right now is a minimal pullback, which won't be visible on higher time frames. The market continues to trade based on its beliefs, expectations, and reasoning. More than half of macroeconomic data are being ignored. Volatility has significantly decreased over the past week, and many technical levels are being overlooked due to weak movements. Overall, the currency market is not in an attractive state.
On Tuesday, traders only had access to secondary reports. In the morning, the ZEW economic sentiment indices were released, showing higher-than-expected values, which led to a rise in the euro. During the U.S. session, three reports were published, each exceeding trader expectations. The dollar strengthened along with the euro but resumed its decline for no apparent reason. This is how EUR/USD trading is currently unfolding.
Three trading signals were formed yesterday in the five-minute time frame, but market participants ignored the 1.0935 level throughout the day. As a result, none of the signals led to a profitable trade. Once again, we emphasize that current movements are illogical, non-technical, and do not correspond to macroeconomic fundamentals. Based on Donald Trump's trade wars, the market continues to sell the dollar.
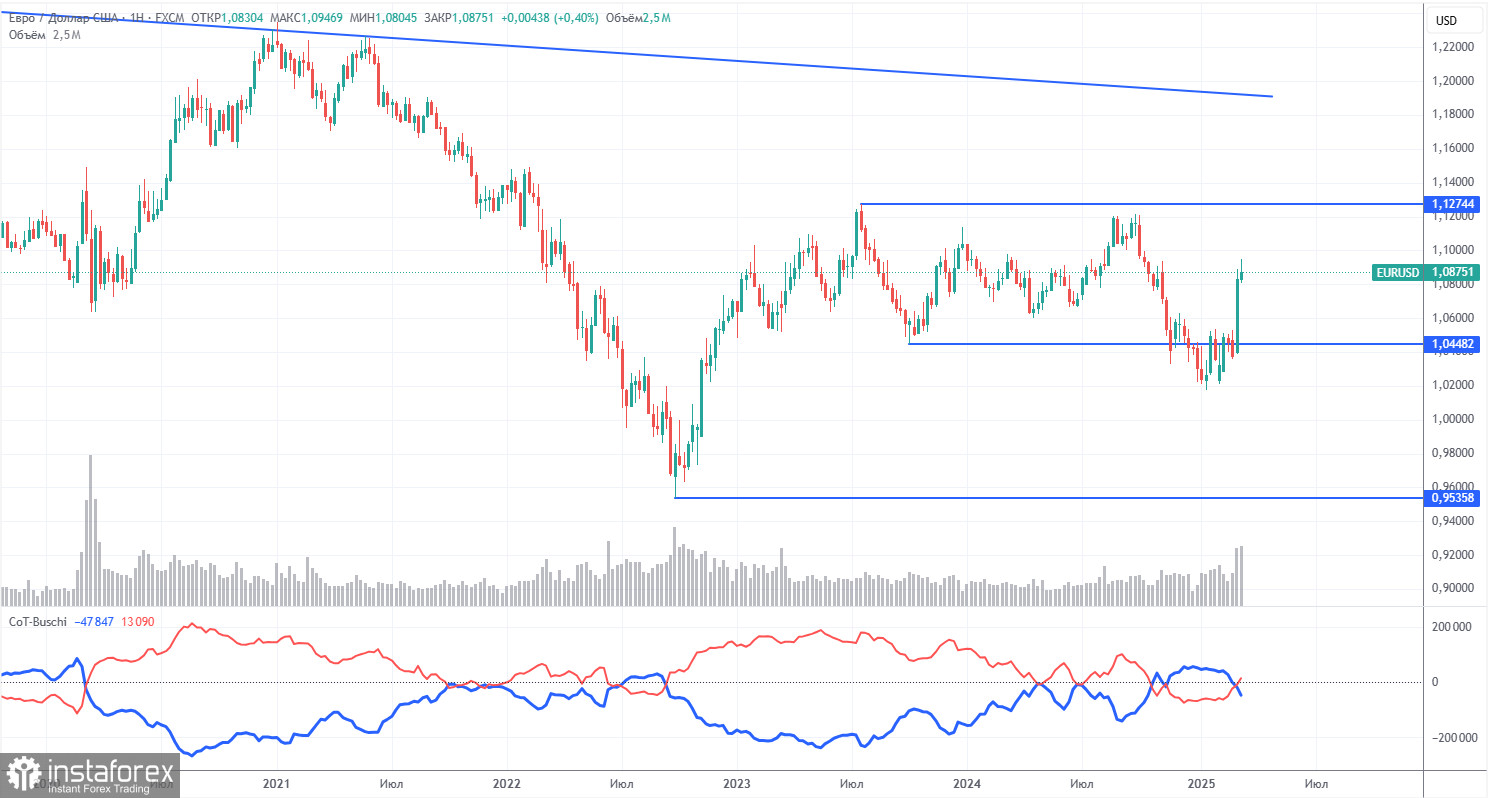
The latest COT report, dated March 11, indicates that the net position of non-commercial traders has remained "bullish" for an extended period. Bears have struggled to gain control, but bulls are now regaining the upper hand. The advantage that bears once had is diminishing as Trump takes office and the dollar continues to decline. While we cannot definitively predict that the dollar's decline will persist, COT reports reflect the sentiment of major market players, which can change rapidly under current circumstances.
Although there are still no fundamental factors to justify a strengthening of the euro, one significant factor is currently weighing on the dollar. The EUR/USD pair may continue to correct for several weeks or even months, but it is unlikely that the 16-year downward trend will be reversed quickly.
At present, the red and blue lines have crossed again, indicating a "bullish" market trend. Over the last reporting week, long positions among non-commercial traders increased by 3,400, while short positions decreased by 19,800. As a result, the net position rose by another 23,200 contracts.
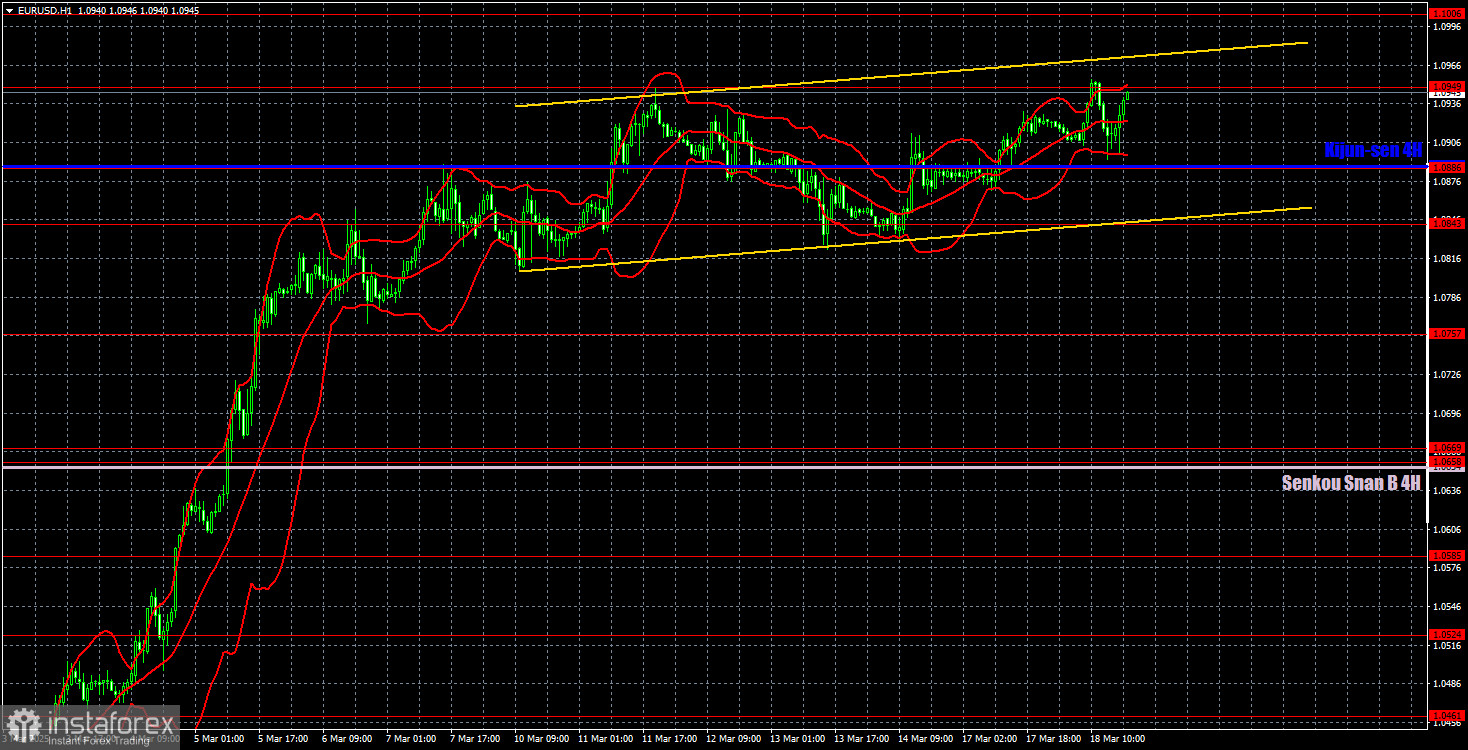
The price continues to move upward on the hourly time frame, albeit not as strongly as before. A decline will likely resume in the medium term due to the difference in monetary policies between the ECB and the Fed. However, it is unknown how long the market will continue reacting solely to the "Trump factor." The current upward movement is merely panic in the market, and its final destination is unclear. Traders ignore many news events and reports except Donald Trump's statements. The dollar is being sold off at every opportunity.
For March 19, we highlight the following trading levels: 1.0340-1.0366, 1.0461, 1.0524, 1.0585, 1.0658-1.0669, 1.0757, 1.0797, 1.0843, 1.0886, 1.0949, 1.1006, 1.1092, as well as the Senkou Span B (1.0654) and Kijun-sen (1.0887) lines. The Ichimoku indicator lines may shift during the day, which should be considered when determining trading signals. Don't forget to place a Stop Loss order at breakeven if the price moves 15 pips in the right direction to protect against potential losses in case of a false signal.
On Wednesday, the European Union will release the February Consumer Price Index, the second estimate, which holds little significance. Second estimates rarely differ from the first, so we do not expect a strong reaction to this report. However, in the evening, the Fed meeting will conclude, Jerome Powell will speak, the "dot plot" chart will be published, and the key rate decision will be announced. Therefore, strong volatility can be expected in the evening, though it is unlikely to benefit the U.S. dollar...
InstaForex analytical reviews will make you fully aware of market trends! Being an InstaForex client, you are provided with a large number of free services for efficient trading.


