 Zostať
Podmienky obchodovania
Nástroje


is gradually fading, and the market needs new reasons for optimism. Institutional investors who expected a more rapid rise may now be adopting a wait-and-see approach, while retail investors, disappointed by the lack of a sharp rally, may be locking in profits. Another factor is the absence of progress at the legislative level and the lack of clear regulatory frameworks for cryptocurrency companies.
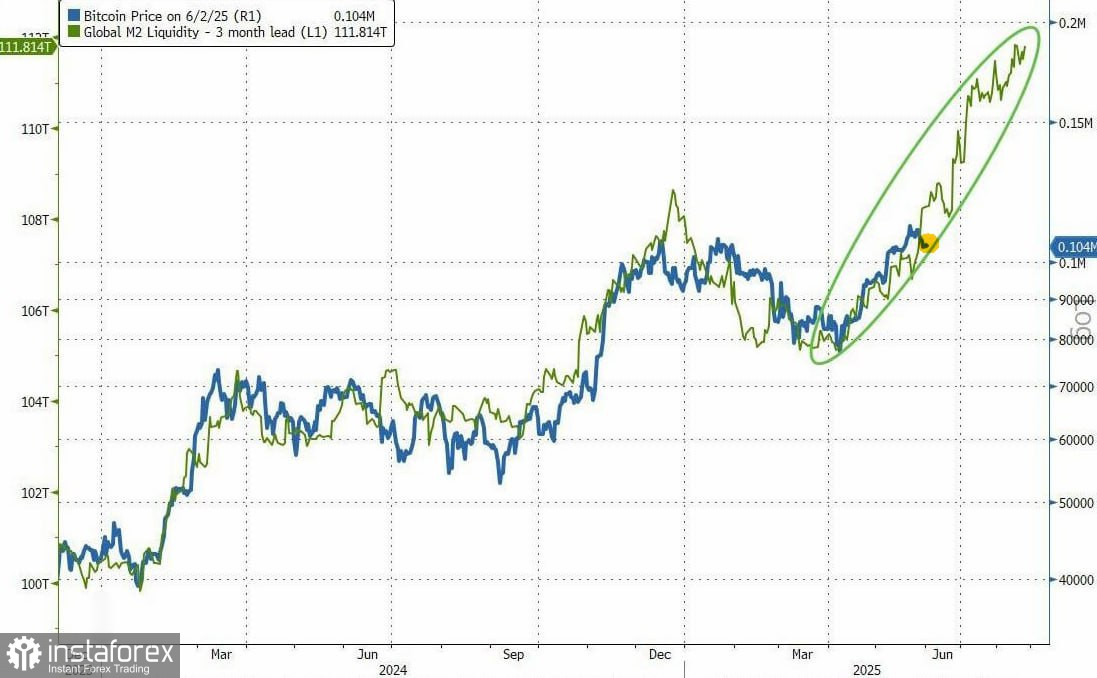
Despite these challenges, the movements in global M2 liquidity and BTC prices are still unfolding quite well. Everything is going according to plan: the positive correlation remains, and BTC continues to follow global liquidity trends. If this correlation holds, new all-time highs could lie ahead.
However, relying solely on this correlation would be reckless. The cryptocurrency market is notorious for its volatility and its ability to defy seemingly inviolable patterns. External factors such as geopolitical events, sudden regulatory changes, or major hacks can instantly invalidate any forecast based on historical data. Thus, it is critically important to assess the situation comprehensively, considering not only macroeconomic indicators but also internal sentiment within the crypto community, technological and infrastructure developments, and the actions of major market players.
Ultimately, success in the cryptocurrency market requires not just knowledge and analytical skills but also discipline, patience, and the ability to adapt to rapidly changing conditions. Even if the current correlation between M2 and BTC persists, it is essential to be prepared for any surprises and have a clear action plan in case of unforeseen circumstances.
Trading Recommendations:
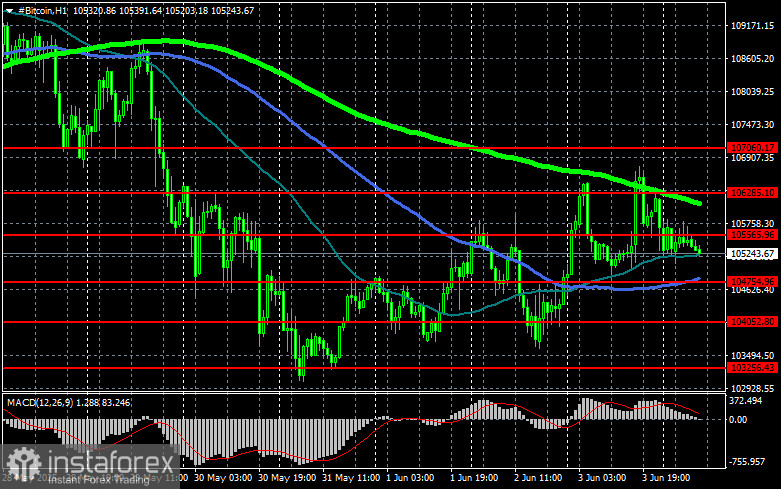
Bitcoin Technical Picture:Buyers are currently aiming to reclaim the $105,500 level, which would open a direct path to $106,200 — and from there, it's a short distance to $107,000. The ultimate target will be the $107,700 level, and breaking through it would signify the strengthening of the bull market. In the event of a Bitcoin drop, buyers are expected around $104,700. A return below this area could quickly push BTC down to the $104,000 region, with the final target being around $103,200.
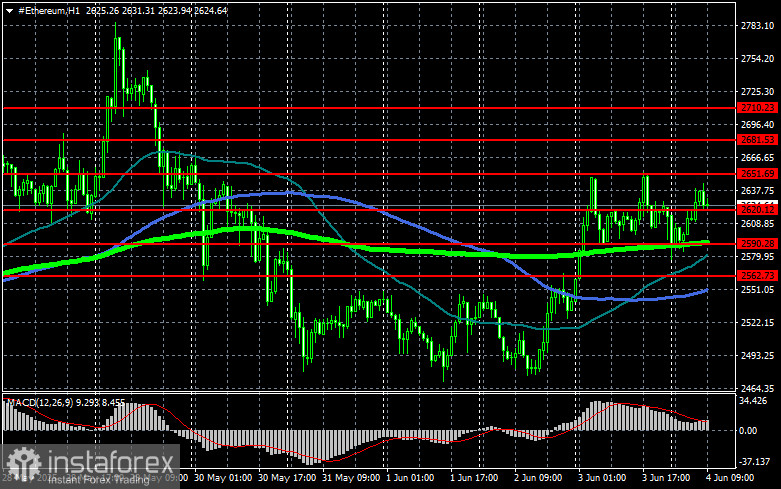
Ethereum Technical Picture:Clear consolidation above the $2,651 level opens a direct path to $2,681. The ultimate target will be the $2,710 level, and a breakout there would signal the establishment of a bullish market. In the event of an Ether decline, buyers are expected around $2,620. A drop below this area could quickly push ETH down to around $2,590, with the final target being around $2,562.
What's on the Chart:
Crossing or testing of moving averages usually either halts the market or sets a new momentum.
InstaForex analytical reviews will make you fully aware of market trends! Being an InstaForex client, you are provided with a large number of free services for efficient trading.


