 Zostať

Podmienky obchodovania
Nástroje


The 4-hour (H4) chart for Gold (GOLD) reveals a clear positive shift in price action. The price is currently trading at the 4366.80 level, having successfully broken out of the bearish corrective range and stabilized above it, driven by increased buying pressure.
Technical Reading and Price Action
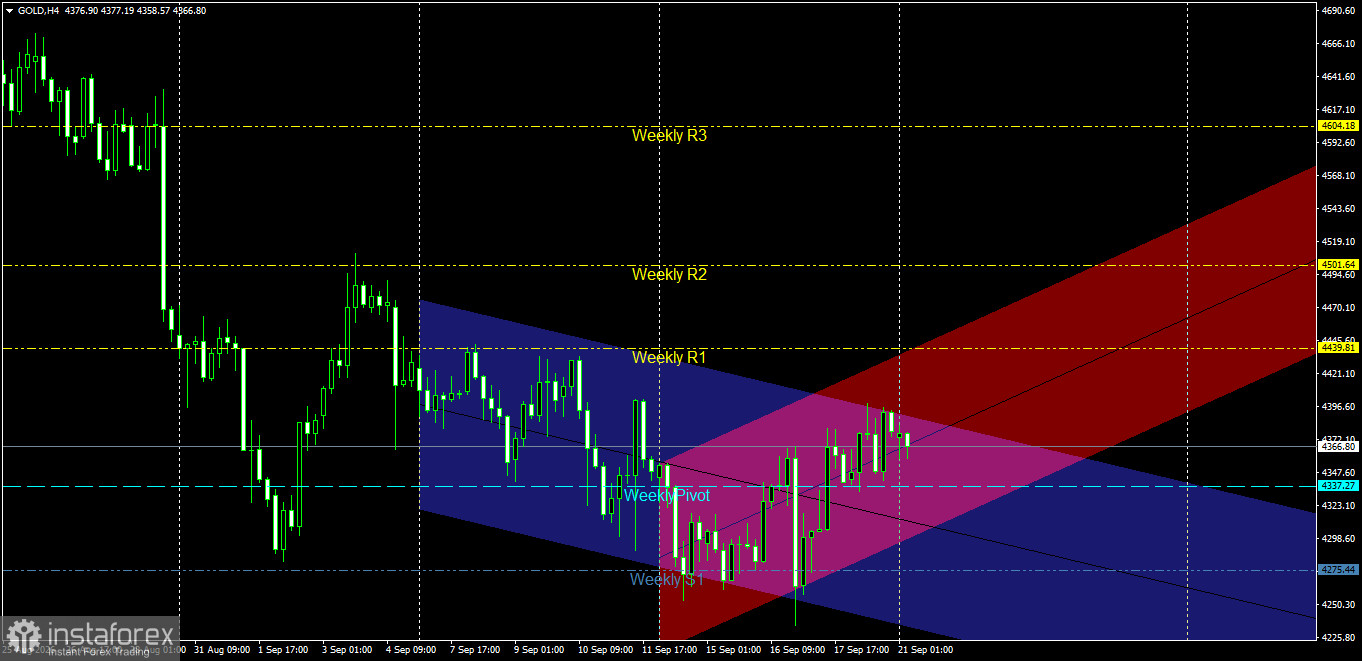
Bullish Channel Structure: Gold is moving within a primary rising channel (blue) and a minor rising channel characterized by accelerating momentum (pink). The price previously surged to record a local high near the first daily resistance level (Daily R1) at 4406.78 before entering a mild bearish correction.
Interaction with Pivot Levels: The price is currently trading below the daily pivot level (4370.30) and is constrained above the monthly pivot level (4387.35)—which has shifted into an intraday resistance—while finding support from below at the weekly pivot level (4337.27) and the first daily support level (Daily S1) at 4341.51.
Key Support and Resistance Levels
Key Resistance Levels:
Resistance 1: The range between 4370.30 and 4387.35 (Daily Pivot and Monthly Pivot).
Resistance 2: The 4406.78 level (Daily R1 and the previous high).
Key Support Levels:
Support 1: The range between 4341.51 and 4337.27 (Daily S1 and Weekly Pivot). Second Support: 4305.03 (Daily S2).
Key Support: 4276.24 (Daily S3).
Price Action Outlook and Trading Recommendations
Bullish Scenario (Primary):
A continuation of the upward trend is the most likely scenario, provided the price remains stable above the 4341.51–4337.27 support range and within the main blue channel.
Recommendation: Buy at current levels or upon a positive rebound from the 4340.00 area.
Technical Targets: Re-breaking the 4370.30 level, then targeting 4387.35 as the first target, and extending toward 4406.78 as the second target.
Stop Loss: A one-hour candle close below the 4330.00 level.
Bearish Corrective Scenario (Alternative):
This scenario is triggered if the price breaks the lower boundaries of the two bullish channels and exits the upward trajectory.
Confirmation Condition: Breaking the weekly pivot level of 4337.27 and closing below it with a full one-hour candle.
Technical Targets: A pullback targeting the next support levels at 4305.03, followed by 4276.24.
Risk Management
It is recommended to monitor price action near the weekly and daily pivot zones for confirmation signals, while strictly adhering to stop-loss levels to protect the portfolio and avoiding risks exceeding 1% to 2% of capital.
InstaForex analytical reviews will make you fully aware of market trends! Being an InstaForex client, you are provided with a large number of free services for efficient trading.


