 Zostať
Podmienky obchodovania
Nástroje



The 4-hour (H4) chart for Gold (GOLD) reveals persistent, strong selling pressure and a dominant bearish trend; the price is currently trading at the 4126.32 level following an acceleration of the decline and the breach of several pivotal weekly support levels.
Technical Analysis and Price Action
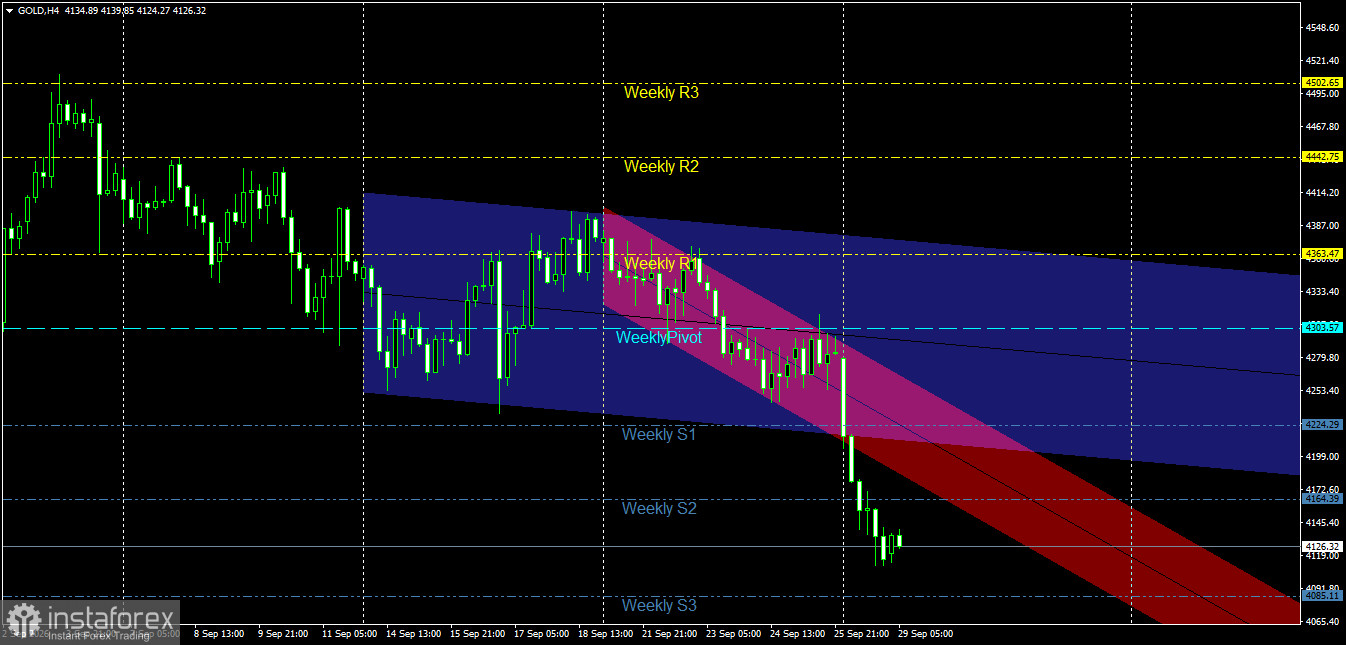
Bearish Channel Structure: Gold is moving within a primary bearish channel (blue) and a secondary, momentum-accelerated bearish channel (pink/red). After failing to stabilize above the first weekly resistance level (Weekly R1) at 4363.47, the price entered a sharp downward wave, breaking the lower boundary of the primary blue channel and sliding into the range of the secondary pink channel.
Breach of Weekly Pivot Levels: Sellers continued to drive the price lower, clearly pushing past the weekly pivot point at 4303.57 and breaking through successive support levels—specifically Weekly S1 at 4224.29 and Weekly S2 at 4164.39. Consequently, the price is now trading near the recent local low, around the 4119.00 level.
Pivotal Support and Resistance Levels
Key Resistance Levels:
Resistance 1: 4164.39 (formerly Weekly S2, now acting as resistance).
Resistance 2: 4224.29 (formerly Weekly S1). Pivot Resistance: 4303.57 (Weekly Pivot).
Key Support Levels:
First Support: 4119.00 (Recent intraday low).
Second Support: 4085.11 (Weekly S3 support level).
Key Support: 4065.40.
Price Action Outlook and Trading Recommendations
Bearish Scenario (Primary):
A continuation of the bearish trend is the most likely and appropriate outlook as long as the price trades below the broken levels and remains within the accelerated pink channel.
Recommendation: Sell upon any corrective retest near the 4164.39 – 4199.00 zone.
Technical Targets: Breaking the 4119.00 level opens the way to target the Weekly S3 support at 4085.11 as the primary target, with a potential extension to 4065.40 as the second target.
Stop Loss: A 4-hour candle close above 4224.29.
Bullish Corrective Scenario (Alternative):
This scenario activates if buying pressure emerges, driving a corrective rebound that pushes the price back above the previously broken levels.
Validation Condition: Breaking above 4164.39 and closing above 4224.29 on a 4-hour candle.
Technical Targets: A return to retest the Weekly Pivot point at 4303.57. Risk Management
Trading amidst the current sharp volatility requires strict adherence to risk management principles and the precise setting of stop-loss orders, while ensuring that no more than 1% to 2% of total capital is risked per trade.
The 1-hour (H1) chart for Gold (GOLD) prices reveals a clear, rapid bearish trend. The price is currently trading around the 4126.69 level, attempting to stabilize following a sharp decline that drove it to new lows during recent trading sessions.
Technical Analysis and Price Action
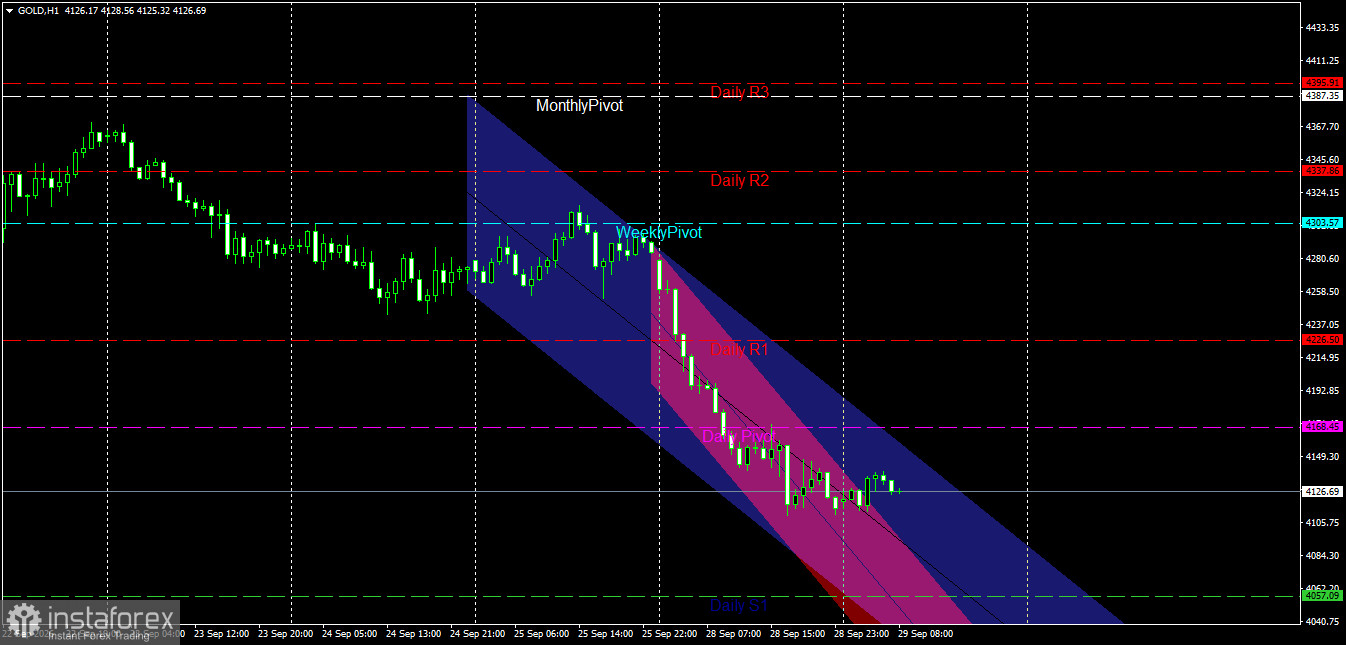
Bearish Channel Structure: The price is moving within a primary bearish channel (blue) that reflects the overall downward trajectory, alongside a secondary, momentum-accelerating bearish channel (pink/red). Gold faced intense selling pressure after failing to break through upper resistance zones near the Monthly Pivot (4387.35) and the second daily resistance level (Daily R2) at 4337.86.
Interaction with Pivot Levels: Sellers successfully broke through key pivot levels in succession, starting with the Weekly Pivot (4303.57), passing through the first daily resistance level (Daily R1) at 4226.50, and finally breaking the Daily Pivot (4168.45), which has now turned into a critical near-term resistance level.
Key Support and Resistance Levels
Key Resistance Levels:
Resistance 1: 4168.45 (Daily Pivot, now acting as resistance).
Resistance 2: 4226.50 (Broken Daily R1). Pivot Resistance: Level 4303.57 (Weekly Pivot).
Key Support Levels:
First Support: Pivot zone between 4105.75 and 4084.30 (recent intraday lows and the lower boundary of the minor channel).
Second Support: Level 4057.09 (Daily S1).
Price Action Outlook and Trading Recommendations
Bearish Scenario (Primary):
The bearish scenario is considered the most likely and appropriate given current movements, provided the price trades below the daily pivot level of 4168.45 and within the pink minor channel.
Recommendation: Sell on any corrective rebound toward the 4149.30 – 4168.45 range.
Technical Targets: Breaking current intraday levels paves the way to target the first daily support at 4057.09 as a primary objective, with a subsequent extension toward 4040.75.
Stop Loss: A one-hour candle close above 4192.85.
Bullish Corrective Scenario (Alternative):
This scenario activates if sudden buying momentum emerges, causing the price to rebound and break above recently breached levels.
Validation Condition: Breaking the 4168.45 level and stabilizing above it with a one-hour candle.
Technical Targets: Initiation of a bullish correction targeting a retest of the 4226.50 level. Risk Management
Trading gold amidst the current rapid market movements requires a strict commitment to placing stop-loss orders and limiting the risk per trade to between 1% and 2% of capital.
InstaForex analytical reviews will make you fully aware of market trends! Being an InstaForex client, you are provided with a large number of free services for efficient trading.


