 Zostať


Podmienky obchodovania
Nástroje


The four-hour (H4) chart for Gold (GOLD) reveals a bearish price action that is strongly dominating intraday trading. The price is currently trading at 4087.36, marking a notable decline that has broken through several key pivot levels and is now heading toward testing major support boundaries for the short and medium term.
Technical Analysis and Price Action
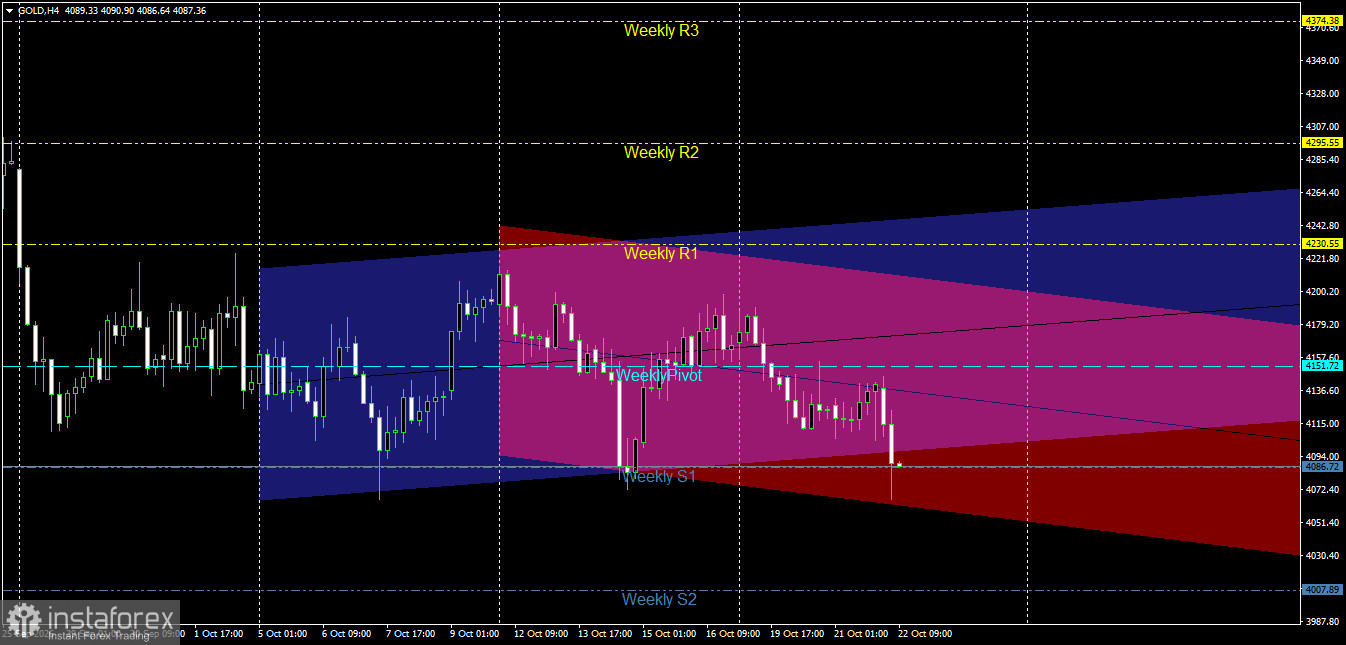
Price Channel Structure: The price is moving within a broad, primary channel (in blue), which encompasses a secondary, descending channel (in pink/red). It is evident that the price failed to sustain its previous gains; having breached the median lines of these channels, it is now positioned near the lower boundary of the secondary channel and the first weekly support level. This reflects a strong grip by the bears (sellers) on the current price movement.
Interaction with Weekly Pivot Levels: The price has decisively broken below the weekly pivot point at 4151.72. This level, which previously acted as support, has now shifted into a resistance level, exerting downward pressure on the price. The decline has continued, bringing the price very close to the first weekly support level (Weekly S1) at 4086.72—a critical line of defense for the bulls (buyers) before a potentially deeper downward wave. Pivotal Support and Resistance Levels
Key Resistance Levels:
First Resistance: 4136.60 – 4151.72 (Weekly Pivot point and a nearby intraday resistance level).
Second Resistance: 4230.55 (Weekly R1 resistance level).
Third Resistance: 4295.55 (Weekly R2 resistance level).
Key Support Levels:
First Support: 4086.72 (Weekly S1 support level and current rebound zone).
Second Support: 4007.89 (Weekly S2 support level and the lower boundary of the main channel).
Pivotal Support: 3980.00 and below, in the event that intense selling pressure persists.
Price Action Outlook and Trading Recommendations
Bearish Scenario (Primary):
A negative trend remains dominant and most likely, provided that trading continues below the weekly pivot point of 4151.72 and below the previously breached support levels.
Recommendation: It is advisable to sell into corrective upward rebounds toward the 4136.00 – 4151.72 range, as long as these levels continue to cap any price advances.
Technical Targets: A break below the current support level, targeting 4050.00, with potential for further extension toward the second weekly support level at 4007.89. Corrective Bullish Scenario (Alternative):
This scenario is triggered if sudden buying pressure emerges from the current support zones near 4086.72, pushing the price upward to break through the weekly pivot point.
Confirmation Condition: A 4-hour candle must close clearly above the 4151.72 level.
Technical Targets: This would pave the way for a positive correction, targeting the 4200.00 level, followed by the first weekly resistance at 4230.55.
Risk Management:
Trading during rapid downward waves requires strict adherence to capital management protocols. Risk per trade should be limited to a maximum of 2%, and stop-loss orders must be precisely placed to protect the portfolio against sudden, sharp reversals.
Gold Price on the Daily Chart:
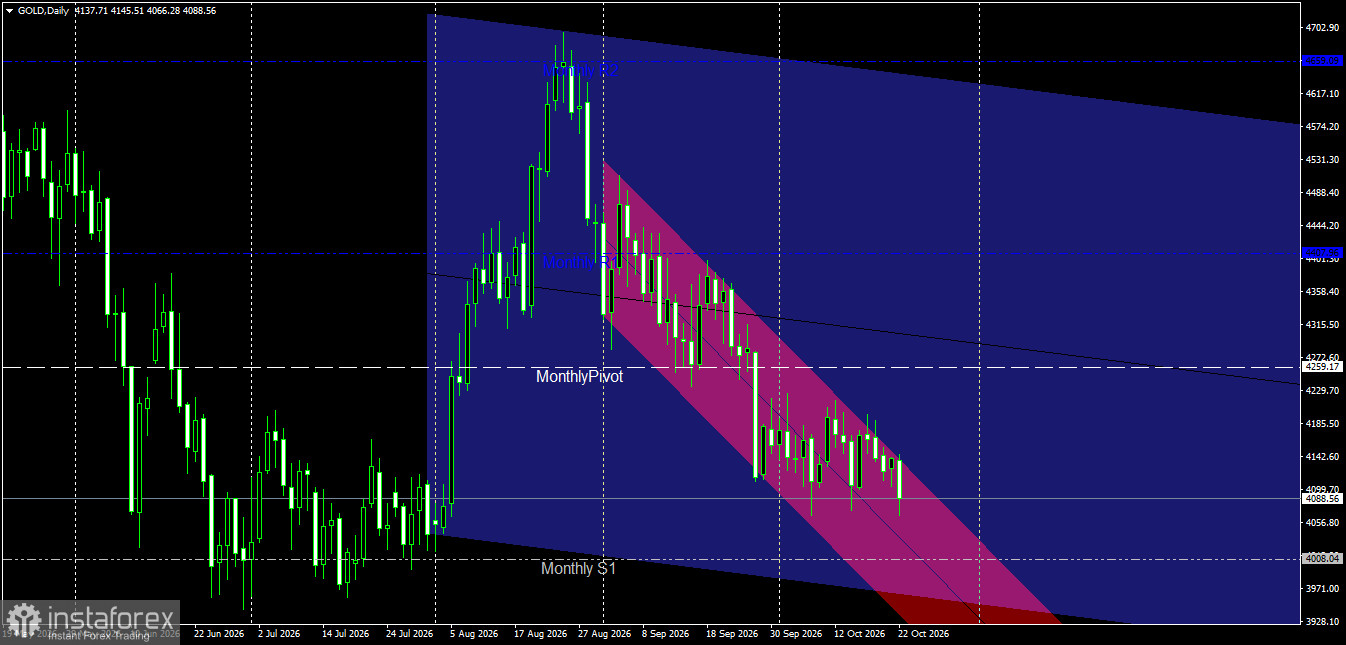
The price is currently trading at 4088.56 within a descending channel on the daily timeframe, reflecting a notable decline driven by persistent selling pressure and positioning below key pivot levels.
Analysis of Yesterday's Candle: Yesterday's candle signaled the continuation of negative pressure, with a marked downward movement toward testing the lower boundary of the descending channel and nearby support zones.
Analysis of Today's Candle: The current daily candle indicates a sustained bearish momentum, as the price moves to test further key support levels, with the bears (sellers) clearly in control.
Outlook for Future Price Movement:
Bearish Scenario (Primary): This remains the dominant and highly probable outlook as long as the price continues to trade below the monthly pivot level and nearby resistance levels, with a potential target at the next monthly support level of 4008.04.
Bullish Scenario (Alternative): This would require the emergence of significant buying pressure, leading to a reversal and a breakout above the immediate technical resistance levels, potentially shifting the price back toward a corrective path.
InstaForex analytical reviews will make you fully aware of market trends! Being an InstaForex client, you are provided with a large number of free services for efficient trading.


