 Zostať
Podmienky obchodovania
Nástroje


After a month-and-a-half pause, Bitcoin broke out of the sideways channel on the 4-hour TF. And yesterday, the "bearish" FVG pattern on the daily TF, which we discussed in recent weeks, was worked out. Thus, the flat can be considered complete, and the upward correction on the daily TF continues. However, this correction may end today, because the primary reaction to the FVG has already occurred. We remind traders that the reaction to any pattern or POI area can vary, from weak to strong. POI areas (aka patterns) give traders an opportunity to open trades in zones with a higher probability of reversal and a meaningful move in the forecasted direction. Therefore, we consider opening short positions appropriate at this time.
Overall, we continue to observe a classic trend: sharp, strong trend swings and longer, complex corrections. Recall that on the daily TF, there remains an unworked "bearish" FVG, which serves as the only POI area for sells. And the line of trend structure break is at $107,300. Thus, Bitcoin could rise even to $107,000, and the trend would still remain downward.
As already mentioned above, a sell trading signal has already been formed. Traders already had the opportunity to open short positions. As confirmation, one can wait for the structure break on the hourly TF. On that chart, the CHOCH line lies at $94,550. If that level is confidently overcome, traders may increase short positions. What are the downside targets for Bitcoin? If the correction is complete, the minimum mid-term fall target is $70,800. In 2026, we expect a much stronger decline in the world's primary cryptocurrency.
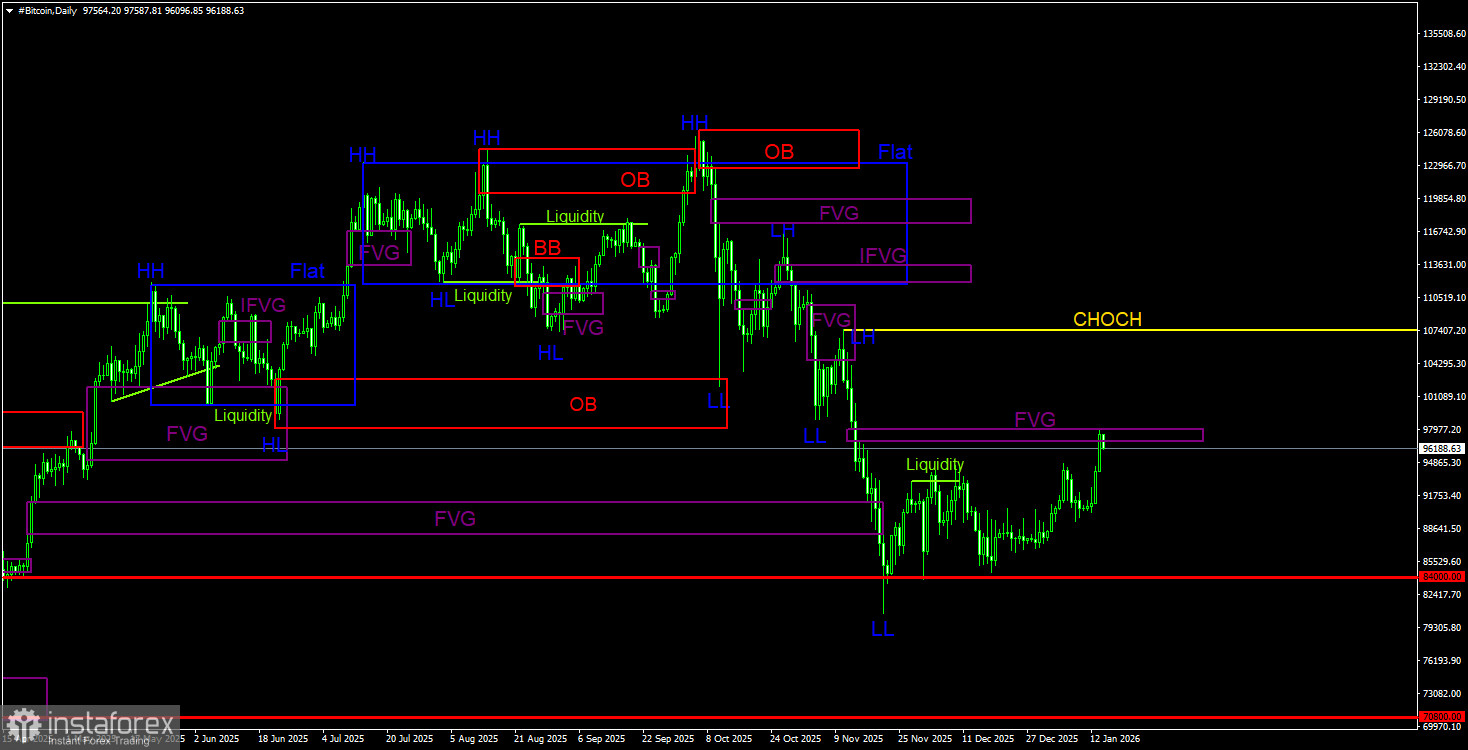
On the daily TF, Bitcoin continues forming a downward trend; the correction continues. The trend structure is identified as downward: the June "bullish" OB was worked out, the April "bullish" FVG was overcome, and the $84,000 level (38.2% Fibonacci) — which we highlighted as the first target — was reached. Further, Bitcoin could fall as low as $60,000, from where its last ascent began. During the last wave, down one small "bearish" FVG was formed, which remains the only POI area for new sales. This area has been worked out; traders can now open short positions. The target of the new leg of downward movement may be $70,800 (50.0% Fibonacci of the three-year uptrend).
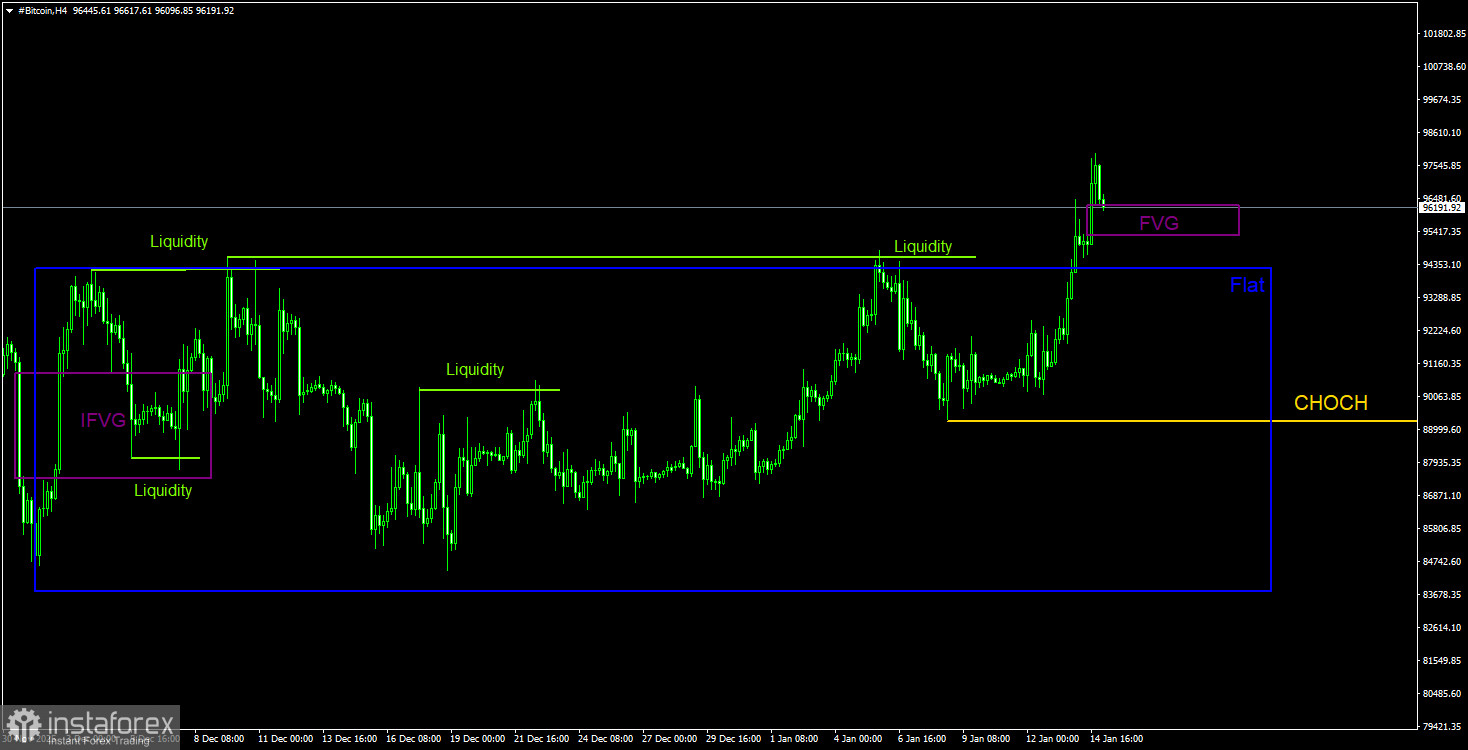
On the 4-hour timeframe, the price exited the sideways channel it had spent a month and a half in. However, Bitcoin's rise may be short-lived, since today the "bearish" daily-TF FVG was worked out. If the price reacts to it (with confirmation), a resumption of the downtrend is possible. Note that on the 4-hour TF, the structure is now upward, and the CHOCH line lies at $89,300. If "bearish" signals are formed, breaking the CHOCH line will become confirmation of the main trend's resumption. Also, pay attention to the local "bullish" FVG. If it is overcome, that will also confirm a new drop of Bitcoin.
Bitcoin broke the bullish structure on the daily TF and, for the first time in 3 years, began forming a full-fledged downtrend. The two nearest targets (the "bullish" OB in the $98,000–$102,700 area and the "bullish" FVG) have been worked out; now expect a fall to $70,800 (the 50.0% Fibonacci level of the three-year uptrend). Of POI areas to sell, only the "bearish" daily-TF FVG in the $96,800–$98,000 area can be highlighted. This pattern was worked out today. Now a sell trade should be accompanied by waiting for various confirmations of the signal.
CHOCH – change of character / break of trend structure.
Liquidity – liquidity, traders' Stop Losses that market makers use to accumulate their positions.
FVG – fair value gap. A price area of inefficiency. Price passes such areas very quickly, indicating a complete absence of one side in the market. Subsequently, the price tends to return and react to such areas.
IFVG – inverted fair value gap. After returning to such an area price does not get a reaction from it but impulsively breaks through and then tests it from the other side.
OB – Order Block. The candle on which a market maker opened a position with the intention of harvesting liquidity to form their own position in the opposite direction.
InstaForex analytical reviews will make you fully aware of market trends! Being an InstaForex client, you are provided with a large number of free services for efficient trading.


