 Zostať
Podmienky obchodovania
Nástroje


EUR/USD
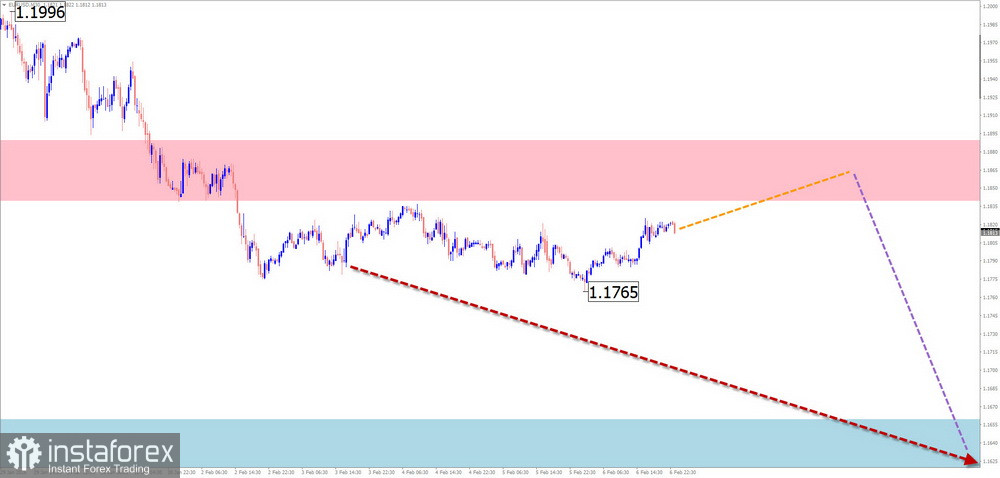
The wave that started in February last year directed the major pair's trend into an upward course. Since the beginning of the current year, the price has been declining, forming a corrective segment (B). Its structure does not show signs of completion at the time of analysis.
During the upcoming weekly period, euro quotes are expected to continue an overall sideways movement. Over the next couple of days, a pullback toward the resistance zone boundaries is likely. After that, a reversal and continuation of the downward movement vector can be expected. The downward price move is anticipated to extend no further than the support zone.
Resistance:
Support:
Sell: Will become available after appropriate reversal signals appear near resistance on your trading systems.Buy: Premature until the current downward wave is fully completed.
USD/JPY
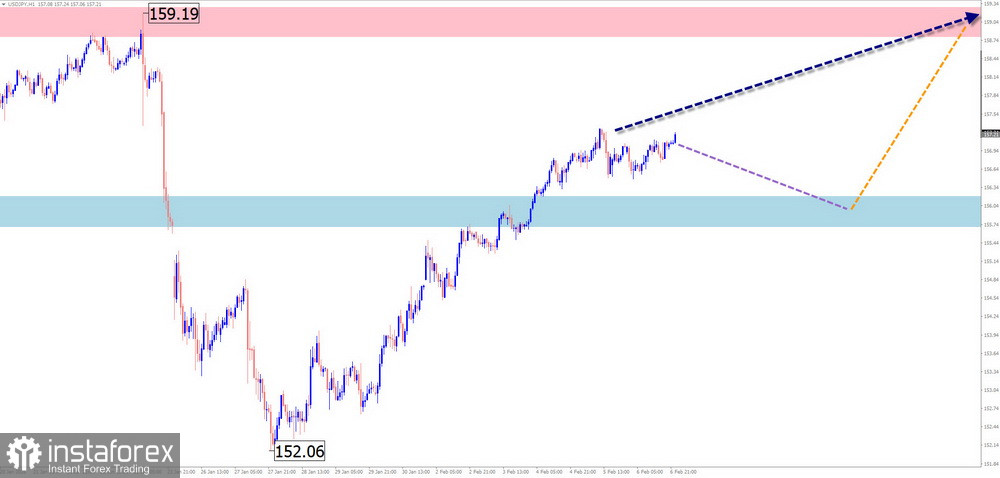
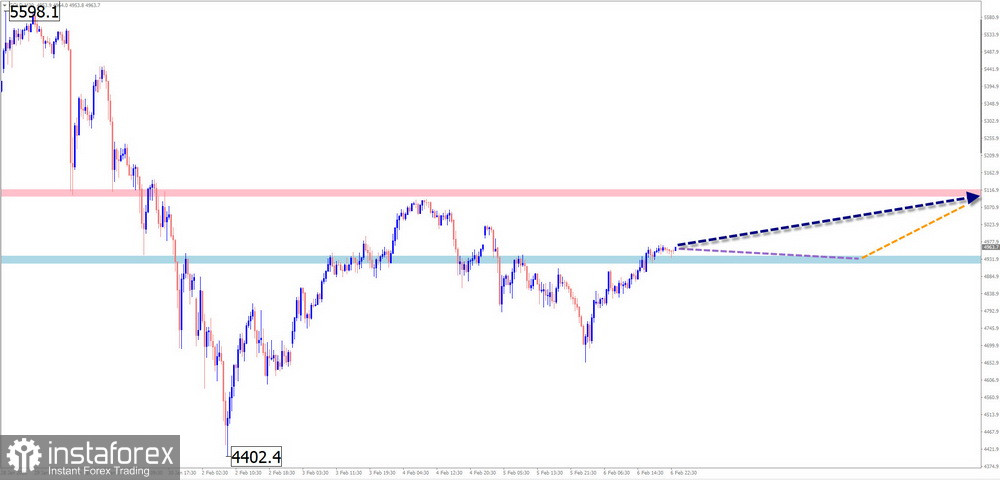
An upward trend has dominated the main Japanese yen pair since April last year. The corrective segment has been unfolding since mid-November. The structure of this wave appears complete. The upward segment from January 27 has reversal potential, and a correction has become necessary within its structure.
In the coming days of the upcoming weekly period, the most likely scenario is continued sideways price movement within the established price channel, along its lower boundary. After probable pressure on the support zone in the coming days, a change in direction and the start of price growth can be expected.
Resistance:
Support:
Sell: Possible with reduced position size intraday. Buy: Will become relevant after reversal signals appear near the calculated support.
GBP/JPY
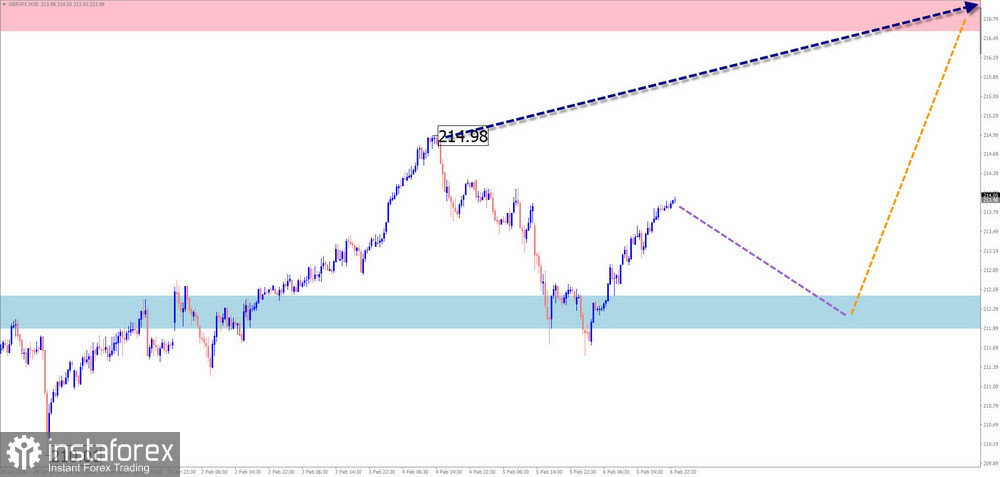
Since December last year, the GBP/JPY pair chart has continued forming an upward wave. Within its structure, an unfinished wave zigzag along the main trend has been developing since January 26. Before growth resumes, the price needs to complete a downward pullback.
During the coming week, price movement is expected to be predominantly sideways. In the next few days, pressure on the support zone is more likely. After that, a reversal and resumption of upward price movement can be expected from this zone. A breakout beyond the calculated counter-trend levels within the current week is unlikely.
Resistance:
Support:
Sell: Low potential; it is safer to reduce position size. Buy: Will become a priority for trading after corresponding reversal signals appear in the support zone.
USD/CAD
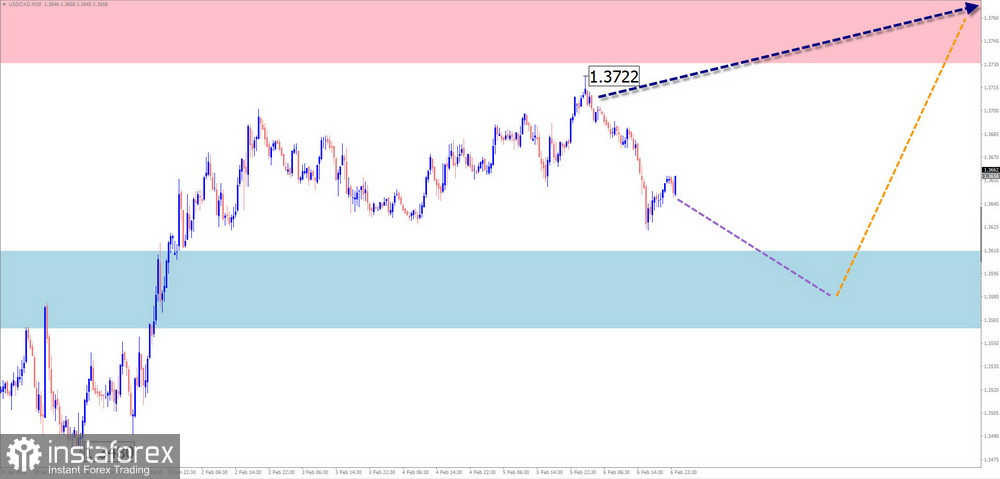
Since November last year, the direction of the Canadian dollar major pair has been defined by a downward wave algorithm. A week ago, quotes formed an upward segment with reversal potential, which, if confirmed, may mark the beginning of a new short-term trend. In recent days, a corrective phase has begun forming within this wave.
Over the next couple of days, a short-term sideways flat with a downward vector is possible, with price declining no further than the calculated support levels. Closer to the weekend, a reversal and resumption of upward movement can be expected, with price growth potentially reaching the resistance zone boundaries.
Resistance:
Support:
Buy: Will become possible after appropriate reversal signals appear near support.Sell: Risky and may result in losses.
Bitcoin
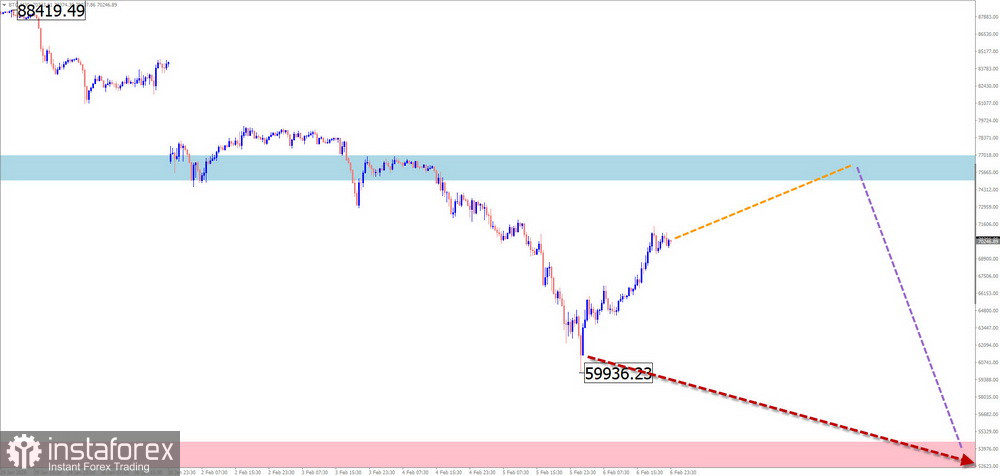
The direction of Bitcoin's short-term trend has been defined by a downward wave algorithm since July last year. Over the past week, the price has begun forming the final segment (C) after a completed correction. Quotes have broken through intermediate support, which has now turned into resistance.
In the first days of the coming week, a predominantly upward price movement is expected. Pressure on the upper boundary of the resistance zone is possible. After that, a change in direction and resumption of the decline can be expected, with price not falling below the support zone. The highest volatility is likely closer to the weekend.
Resistance:
Support:
Buy: Allowed with reduced position size during individual sessions; risky.Sell: Can be used in trading after confirmed reversal signals appear near the resistance zone.
Gold
The gold chart is pulling back downward after setting new peak price levels. The most recent short-term wave model is a bearish wave from January 29 of this year. At the time of analysis, quotes are located within a cluster of potential reversal zones of different scales. Since February 2, the price has been forming a corrective segment along this area. Its structure does not show signs of completion at the time of analysis.
During the upcoming trading sessions, there is a high probability of sideways flat movement along the calculated support boundaries. After that, a reversal and resumption of price growth can be expected. When the direction changes, a short-term break below the lower boundary of the reversal zone cannot be ruled out.
Resistance:
Support:
Sell: Such trades carry a high degree of risk in the coming days.Buy: Will become possible after confirmed reversal signals appear near support.
Notes:
In simplified wave analysis (SWA), all waves consist of three parts (A–B–C). On each timeframe, the latest unfinished wave is analyzed. Dotted lines indicate expected movements.
Attention: The wave algorithm does not take into account the duration of price movements over time.
InstaForex analytical reviews will make you fully aware of market trends! Being an InstaForex client, you are provided with a large number of free services for efficient trading.


